Article by: ETO Markets
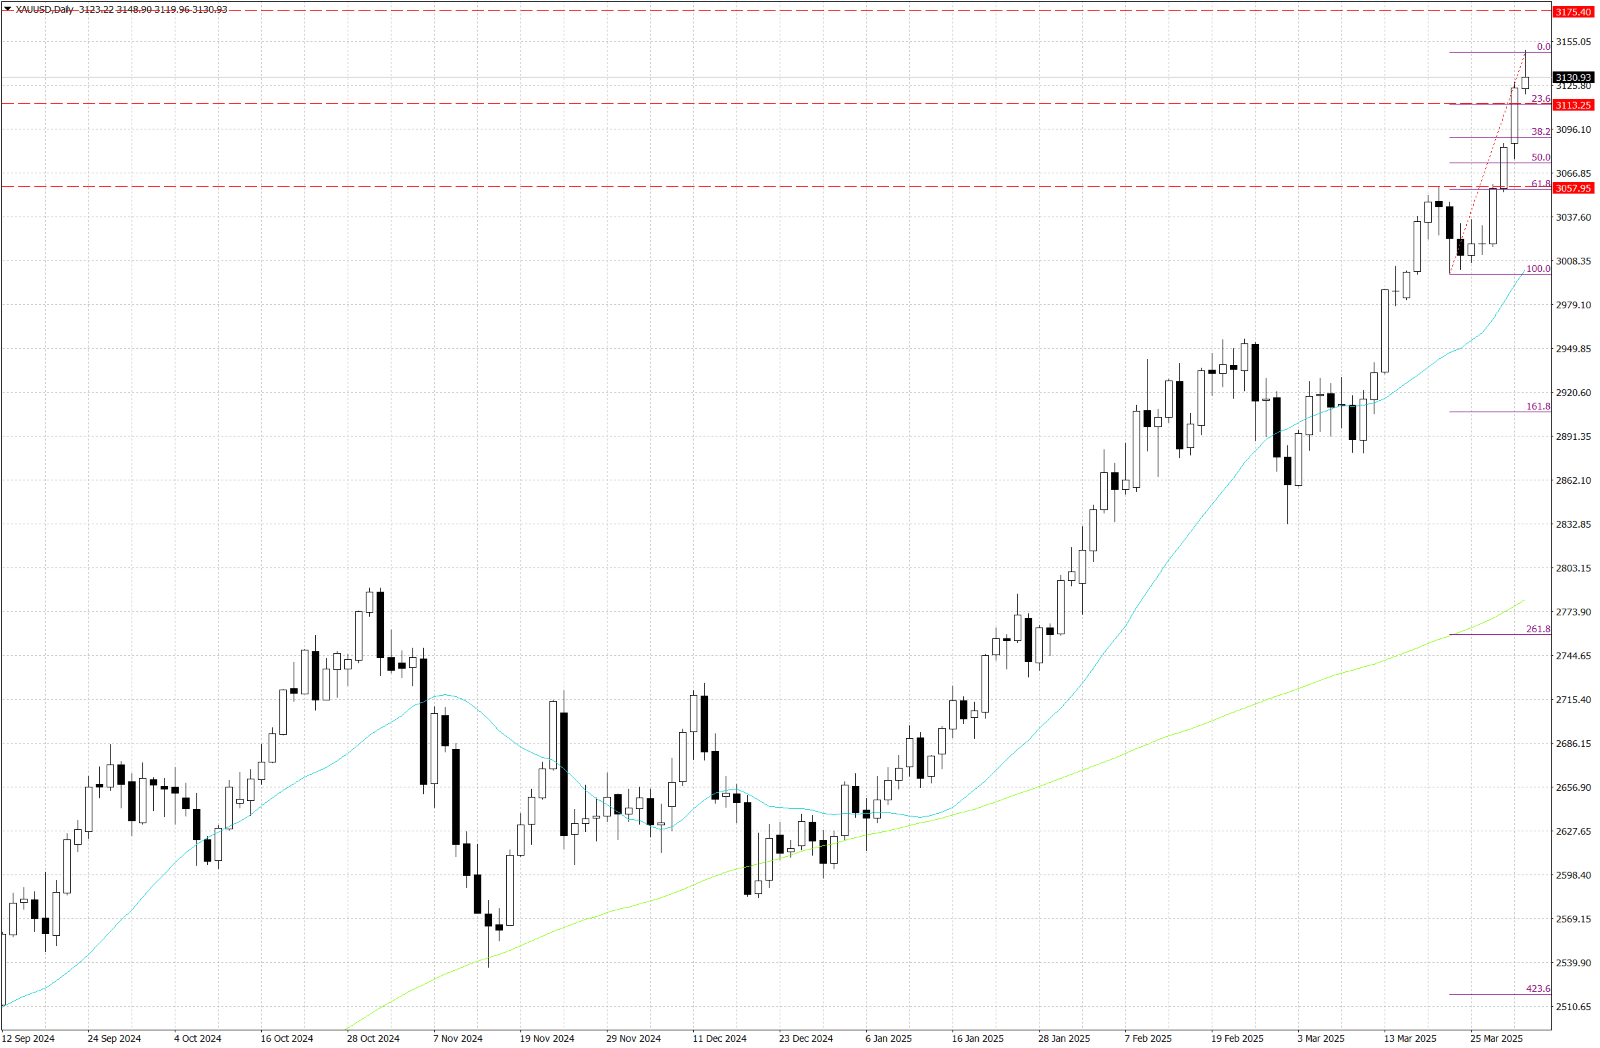
Gold prices are continuing their strong upward trajectory, reaching fresh record highs above $3,130 early Tuesday, propelled primarily by escalating global trade anxieties. Concerns are mounting ahead of the anticipated US announcement on reciprocal tariffs later today, stoking fears of a broader trade conflict and bolstering the metal's safe-haven appeal. Adding fuel to the rally are persistent geopolitical tensions, including developments in Ukraine and the Middle East, alongside market expectations that the US Federal Reserve will soon resume cutting interest rates to counteract a potential tariff-induced economic slowdown. This outlook is keeping US Treasury yields subdued and weighing on the US Dollar, further supporting the non-yielding precious metal. While some improvement in broader risk sentiment might typically challenge gold, the current buying momentum remains largely unaffected, driven by these dominant macroeconomic themes.
From a technical standpoint, although the XAU/USD trend is decisively bullish after convincingly breaking the $… barrier, investors should be acutely aware of the potential for a significant pullback. The daily Relative Strength Index (RSI) reading soaring above 78 signals severely overbought conditions. This, combined with the recent rapid ascent, substantially increases the risk of a sharp correction as profit-taking might set in. Prudence dictates waiting for some consolidation or a retracement before establishing fresh long positions. Immediate support might be found around the 23.6% Fibonacci Retracement near $…. A more convincing break below the significant $… psychological level could trigger further long-unwinding, potentially exposing the previous day's low around $… and then the $… area, which aligns closely with the rapidly ascending 10-day Simple Moving Average. The crucial support zone rests near the $… mark, reinforced by the 20-day SMA and the middle Bollinger Band, likely acting as a key pivot point for traders in the short term. Resistance is less defined at these record highs, with the upper Bollinger Band near $… and the day's peak just below $… representing the immediate upside hurdles. Further breaking could lead the price up to $….


