Article by: ETO Markets
The release of the weak Institute for ISM Manufacturing Purchasing Managers Index for February, which sparked concerns about an economic slowdown, on Friday followed the release of the Personal Consumption Expenditures figures from January, which gave the yellow metal its start. Still, the Fed officials don't waver and stick to their talking points about three rate decreases in 2024, most likely beginning in June. The US Treasury yield may rise if markets confirm their predictions that the easing will begin in June, which might restrict the metal's upside.
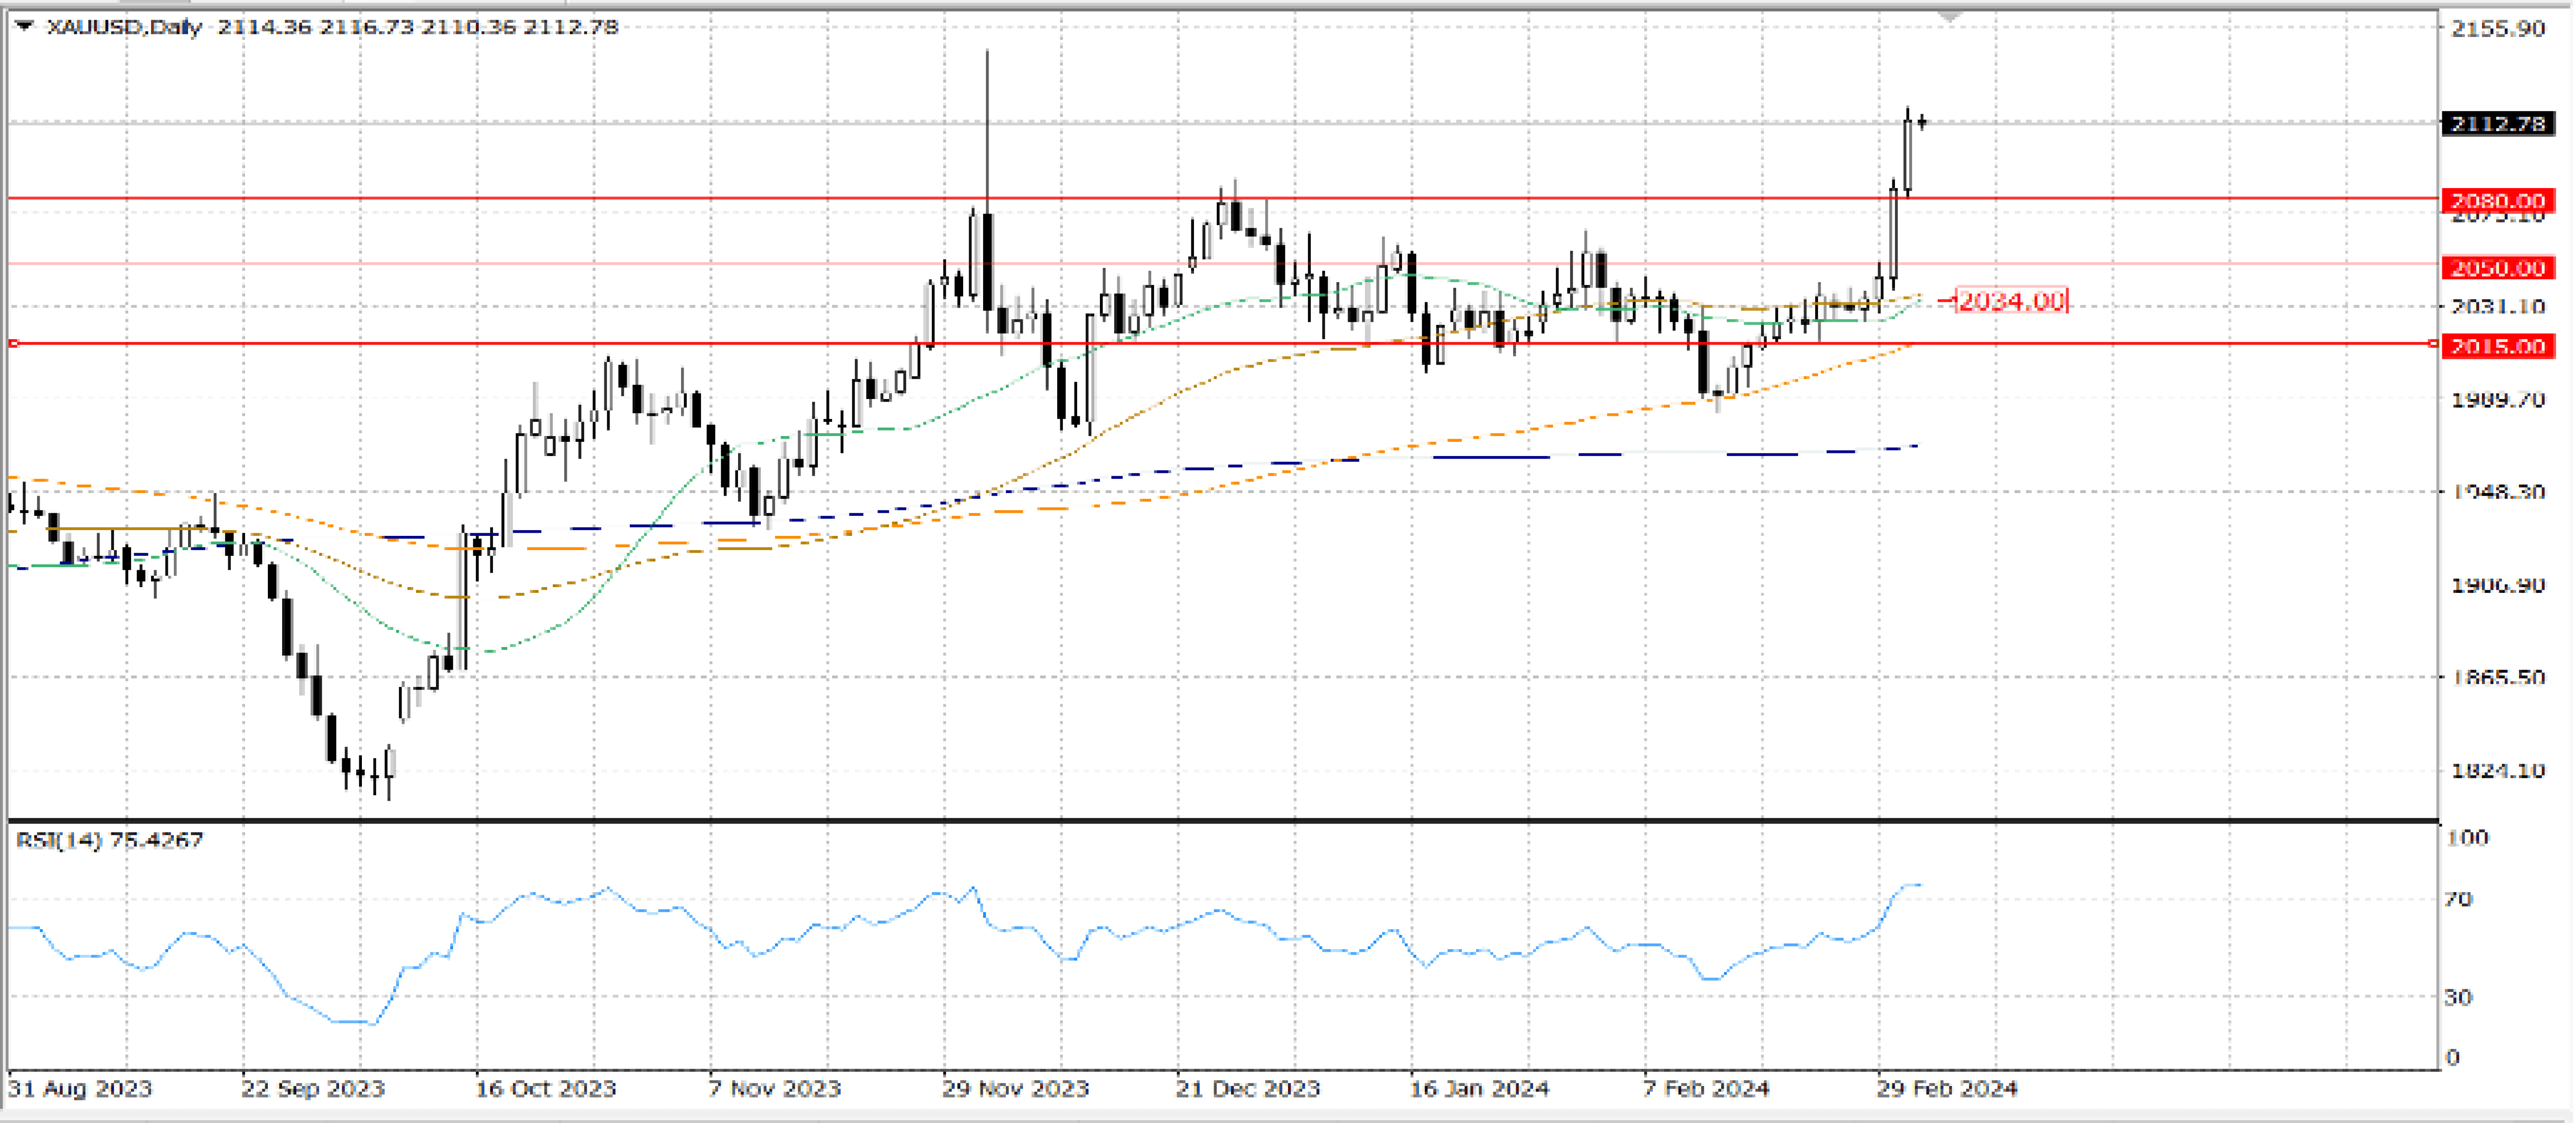
The daily chart for XAU/USD indicates that it is pushing intraday highs of about $… , which is not too distant from the record high of $… set in December. Technical readings on the daily chart indicate that there are no signs of bullish exhaustion, with indicators moving practically vertically northward within the overbought area. Simultaneously, the XAU/USD is rising about $… over a 20-SMA that is currently bullish and accelerating northward above longer ones that are also positive.
Despite severe circumstances, the risk also tilts upward in the near run. The Relative Strength Index aims higher at roughly 76. Converging around $… at the same time, the 100- and 200-SMAs likewise gained upward impetus considerably below the shorter one, while the 20-SMA sped northward much below the current level. However, the support levels are aligned with the psychological $… level and the previously resistance near $...


