Article by: ETO Markets
Gold prices are experiencing modest gains as markets grapple with a complex mix of global uncertainties and upcoming economic developments. Rising tensions in global trade, sparked by President Trump's proposed 25% tariffs on steel and aluminum imports, alongside geopolitical concerns—such as the anticipated US-Ukraine Summit and recent drone attacks on Moscow—are reinforcing gold’s role as a safe-haven asset. At the same time, a softer US dollar, influenced by expectations of potential Federal Reserve rate cuts amid uneven economic signals, is lending additional support to the precious metal. However, attention is also turning to the release of key US inflation figures, including the CPI and PPI, which could shift the Fed’s policy outlook and impact both the dollar’s trajectory and gold’s near-term direction. Gold prices have remained confined within a narrow range during the Asian session on Monday, reflecting a market in cautious balance despite several supportive factors. Concerns over a potential global trade conflict and growing expectations that the Federal Reserve will implement multiple rate cuts this year—fueled by weaker US jobs data and uncertainty around President Trump's unpredictable trade policies—have provided a safety net for the non-yielding bullion, keeping its downside cushioned. Additionally, shifts in Trump's tariff strategies and a slowing US labor market, evidenced by modest job gains and a slight rise in unemployment, have heightened overall economic uncertainty, reinforcing the view that any corrective decline in gold could offer a buying opportunity while still warranting careful positioning given the prevailing market conditions.
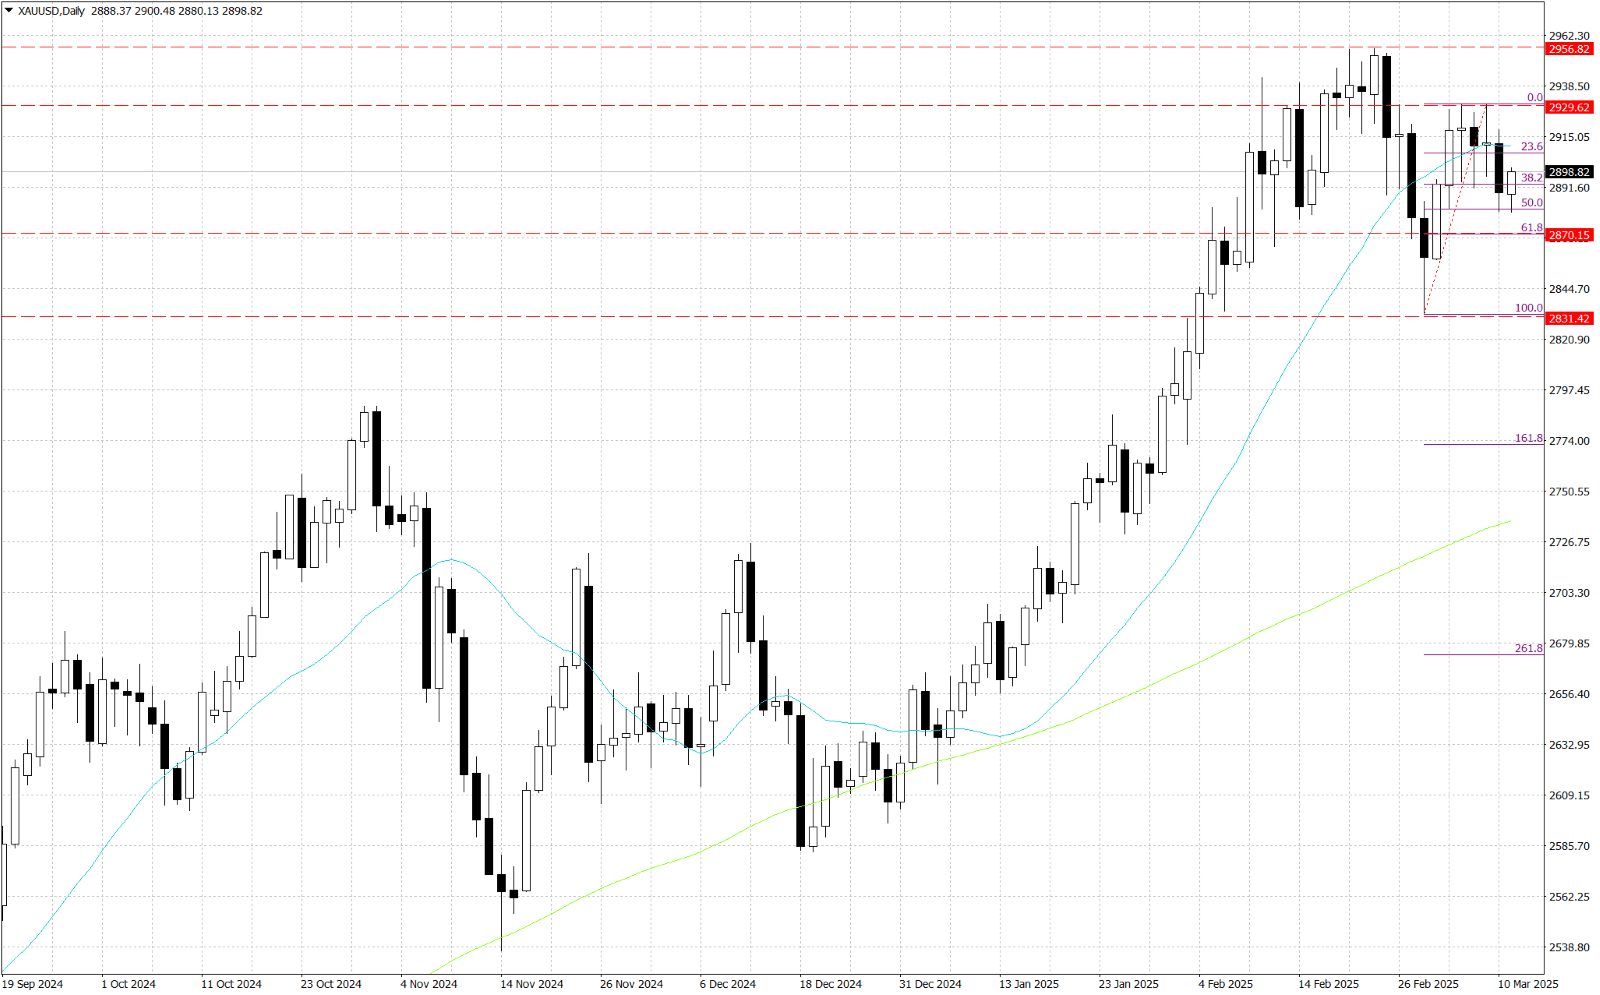
From a technical perspective, XAU/USD is consolidating around $…. Key resistance levels include $…, a psychological barrier where prices have faltered recently, $…, a lower high from early March, and $…, the all-time high from February 24, 2025—a break above could signal bullish momentum. Support lies at $…, the one-week low from March 10-11, $…, aligning with the 61.8% Fibonacci retracement from the $… high to the $… low, and $…, a late February low that previously held firm. These levels, shaped by price extremes and technical significance, are critical for gold’s next move. Traders should monitor them closely, as a breakout above resistance or drop below support could define gold’s direction.