Article by: ETO Markets
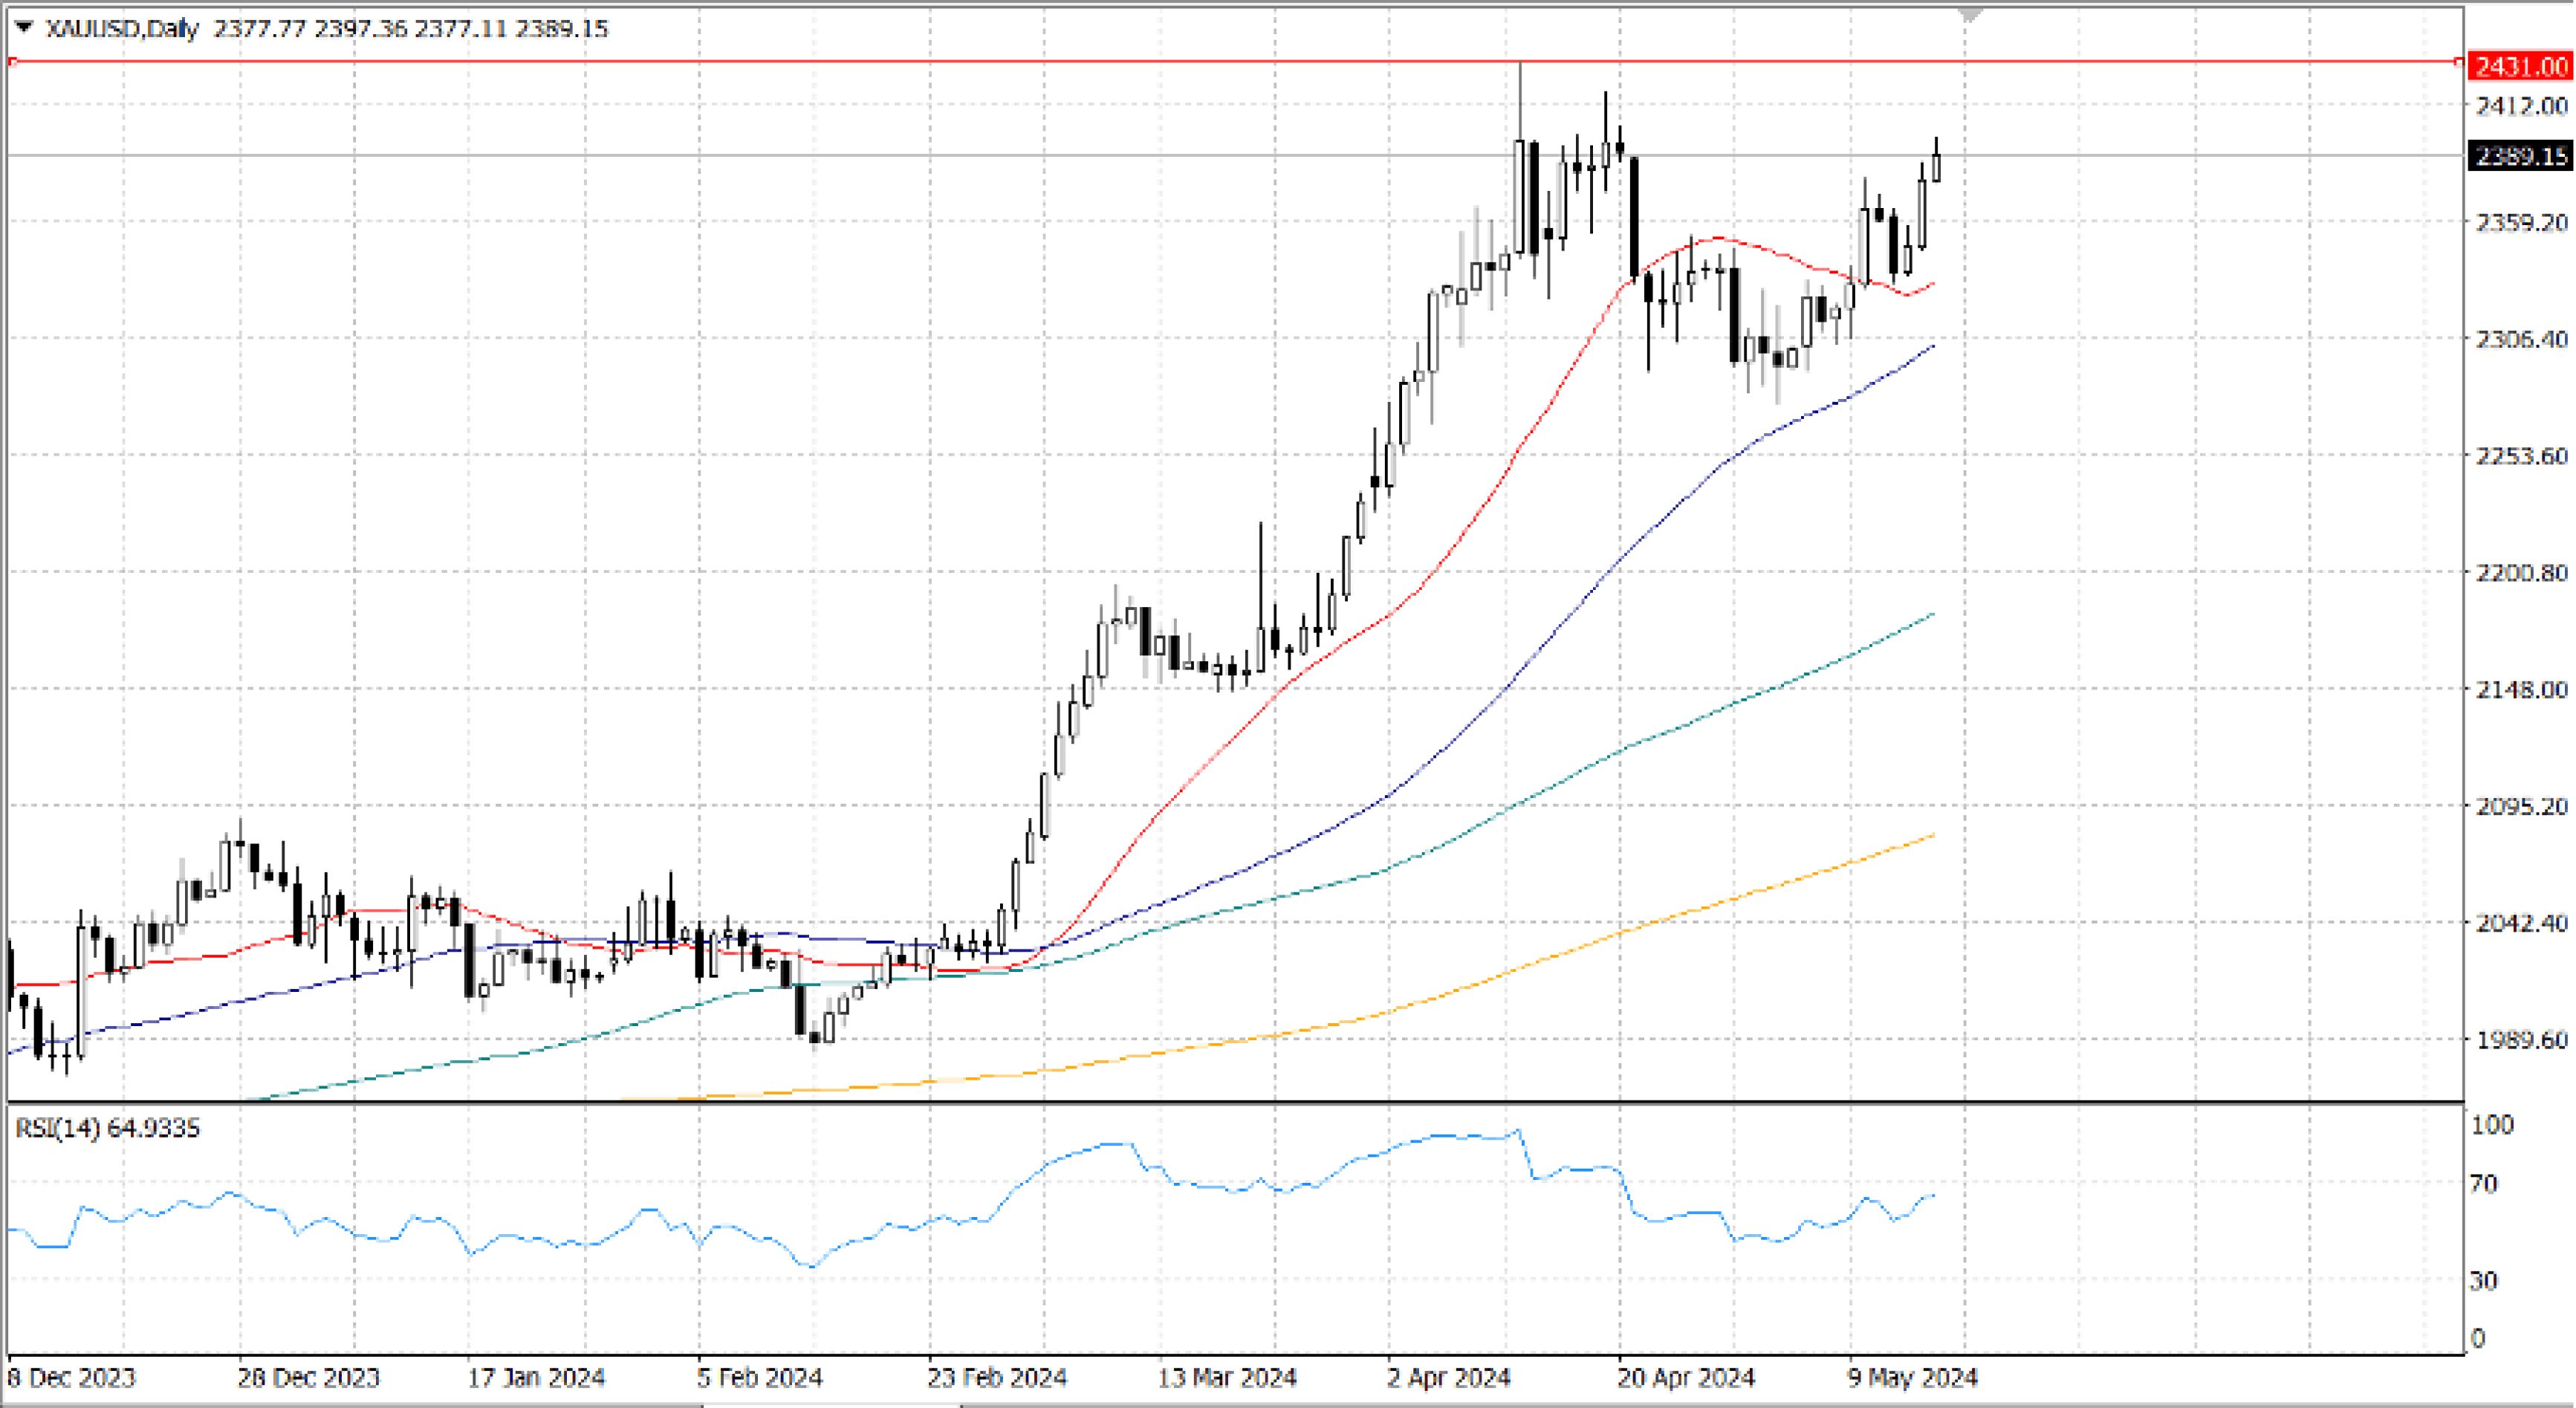
The US Bureau of Labor Statistics released statistics on Wednesday that indicated inflation is declining, raising the likelihood of a Federal Reserve (Fed) rate decrease in 2024. This led to the gold price continuing its upward trend for the second day in a row and reaching a three-week high of $2,390. As a result, US Treasury bond yields are falling, and the US Dollar Index shows that the Greenback is falling to a five-week low.
The initial resistance level for XAU/USD would be $... The immediate supply zone would be the $… high from April 19 and the all-time high of $… , once surpassed. On the other hand, if sellers entered the market and drove prices below $… , that might cause a decline toward the $… , where the 20-DMA is. The 50-DMA at $… would be the next target if it were to be crossed.