Article by: ETO Markets
U.S. macroeconomic data released on Thursday beat expectations, sending gold prices to their lowest in more than two weeks. In the second quarter, GDP grew at an annualized rate of 2.8%, up from 1.4% in the first quarter. At the same time, the core personal consumption expenditures (PCE) price index, the Fed's preferred inflation measure, slowed to 2.9% from 3.7% in the first quarter. The number of Americans filing for unemployment benefits also fell to 235,000, below market expectations. Still, the dollar has weakened on expectations that the Fed will start cutting interest rates in September and make two more cuts before the end of the year, which has provided some support to gold prices. Traders are now looking to the upcoming U.S. PCE price index for June for more clues on the Fed's policy path, which could determine the short-term direction of gold.
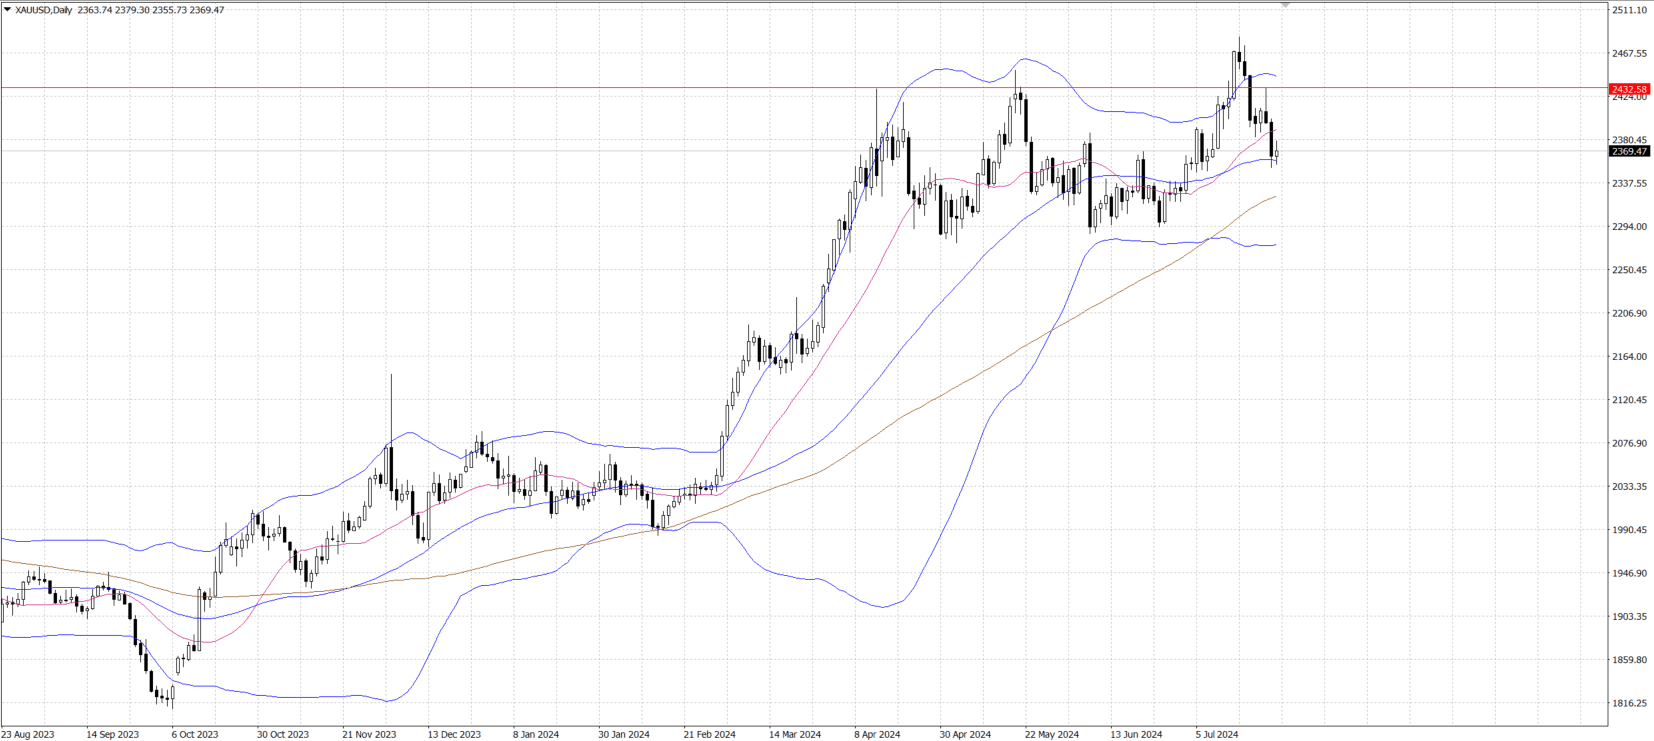
From a technical point of view, gold prices are showing some rebound below the 50-day simple moving average (SMA), temporarily ending a two-day losing streak. However, the volatility indicator on the daily chart has just begun to turn negative, indicating greater downward pressure on gold prices. A break below the previous day's low of $… would confirm a continuation of the recent corrective decline. On the downside, key support lies in the $… - $… area near the 100-day SMA, and a break below this area could lead to a further dip to levels below $… or June lows. On the upside, gold needs to break through resistance in the $… area, followed by strong resistance at the $…-… and $… levels. A break through these resistance could see gold recover to its weekly high of $….


