Article by: ETO Markets
A deteriorating mood contributed to the Greenback's recovery, although sellers' short-term interest also played a role. Investors moved into high-yielding assets due to speculation that the Federal Reserve was done tightening monetary policy. The US Dollar, however, is not able to recover more strongly than it did intraday in the stock markets.
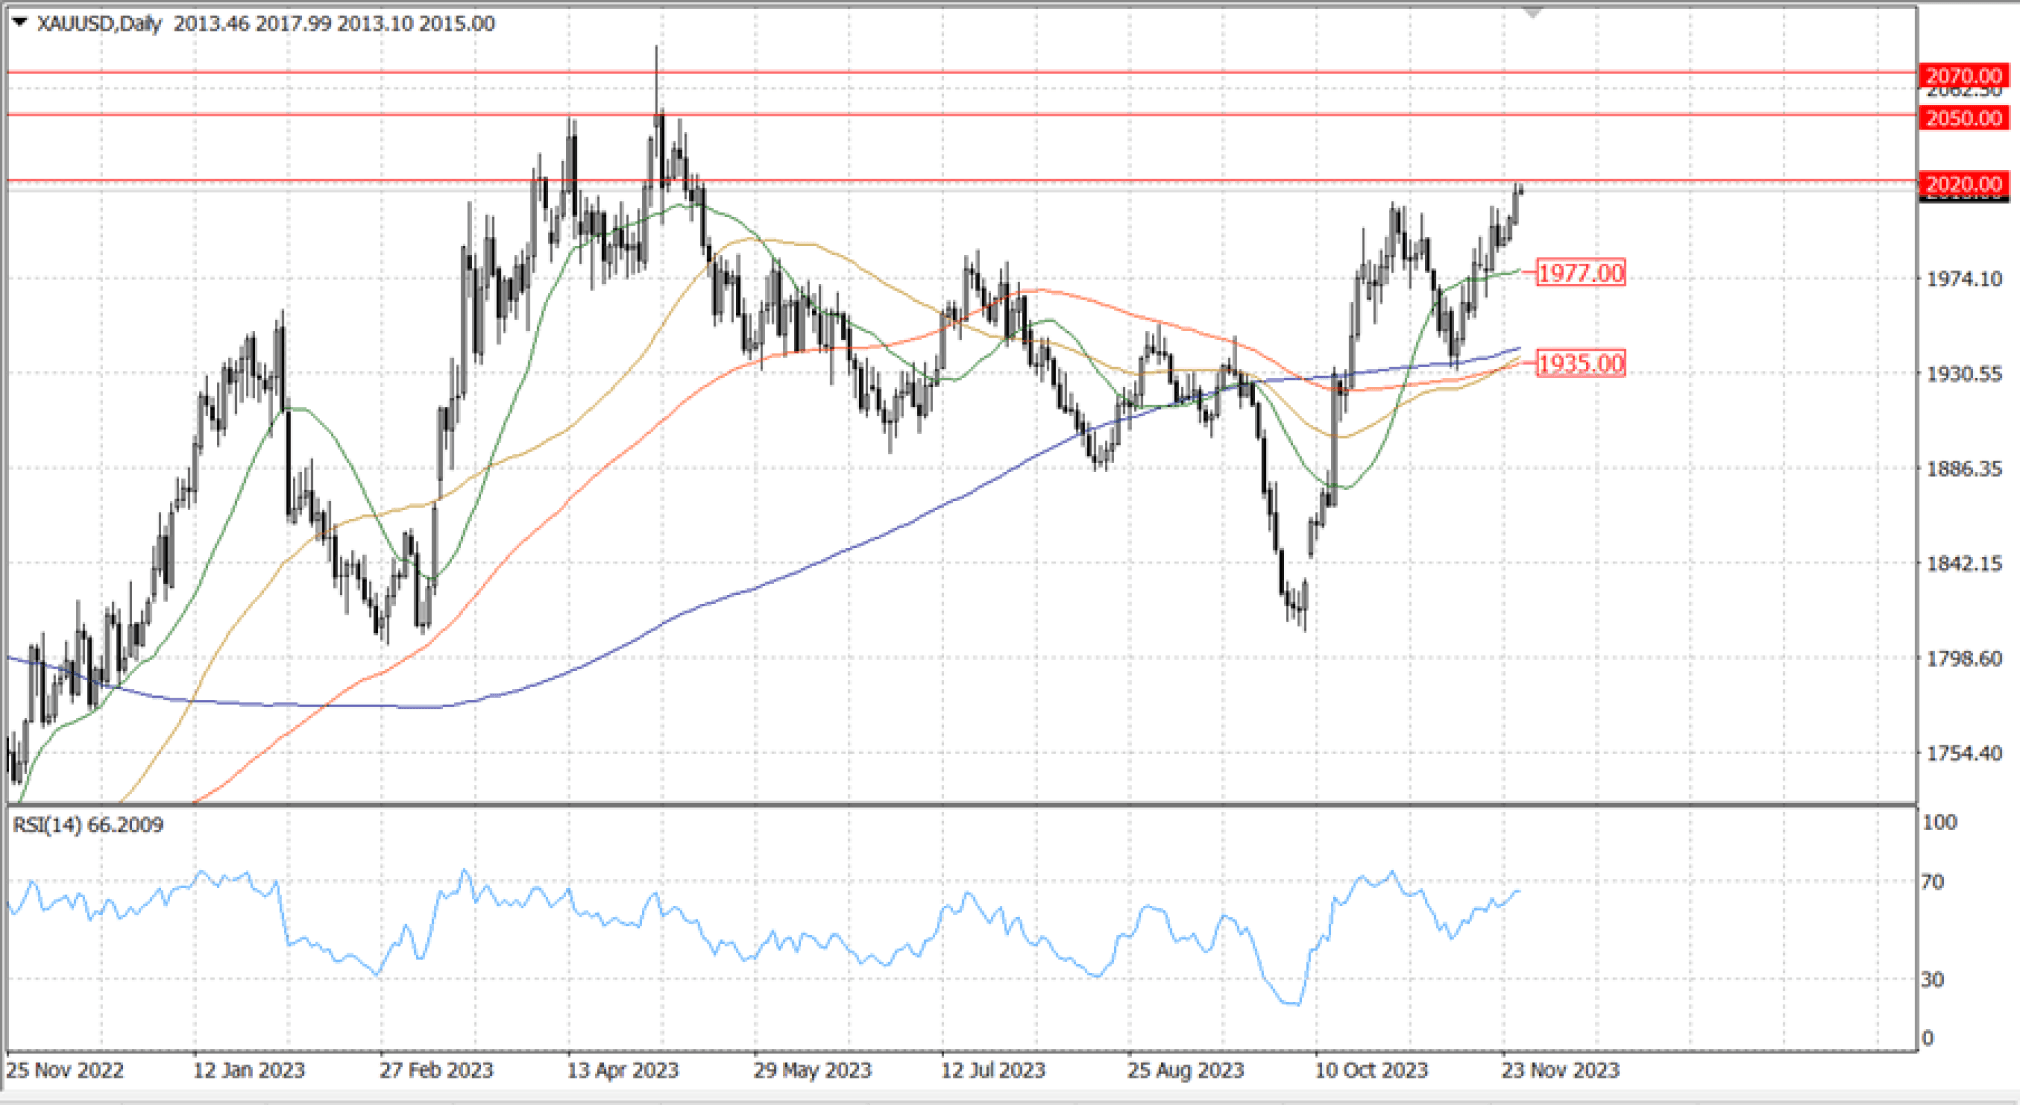
The XAU/USD daily chart, which has recorded a third straight higher high and higher low, suggests that there may be one more leg north. The 20-SMA is currently trading at about $1,976, indicating that the shiny metal is developing well above directionless moving averages. Technical indicators, meanwhile, follow the present rising momentum and point northward inside positive levels and at new one-month highs.
The 4-hour chart indicates that XAU/USD is neutral to positive in the near term. While the longer ones advance unevenly well below the shorter one, gold is comfortably above a bullish 20-SMA. Technical indicators, on the other hand, are bullish but lack directional strength, which means that the risk is skewed upward without any indication of an impending run.


