Article by: ETO Markets
Global commodity markets continue to navigate a complex landscape dominated by geopolitical tensions and policy uncertainties. The transition period between US administrations has heightened risk perception, with concerns over potential military action against Iran's nuclear facilities and escalating Middle East tensions driving safe-haven flows. Market participants must contend with Trump's proposed protectionist policies, potential Chinese stimulus measures, and shifting monetary policy expectations, creating a challenging environment with risk factors including deteriorating manufacturing PMIs globally and uncertain central bank trajectories.
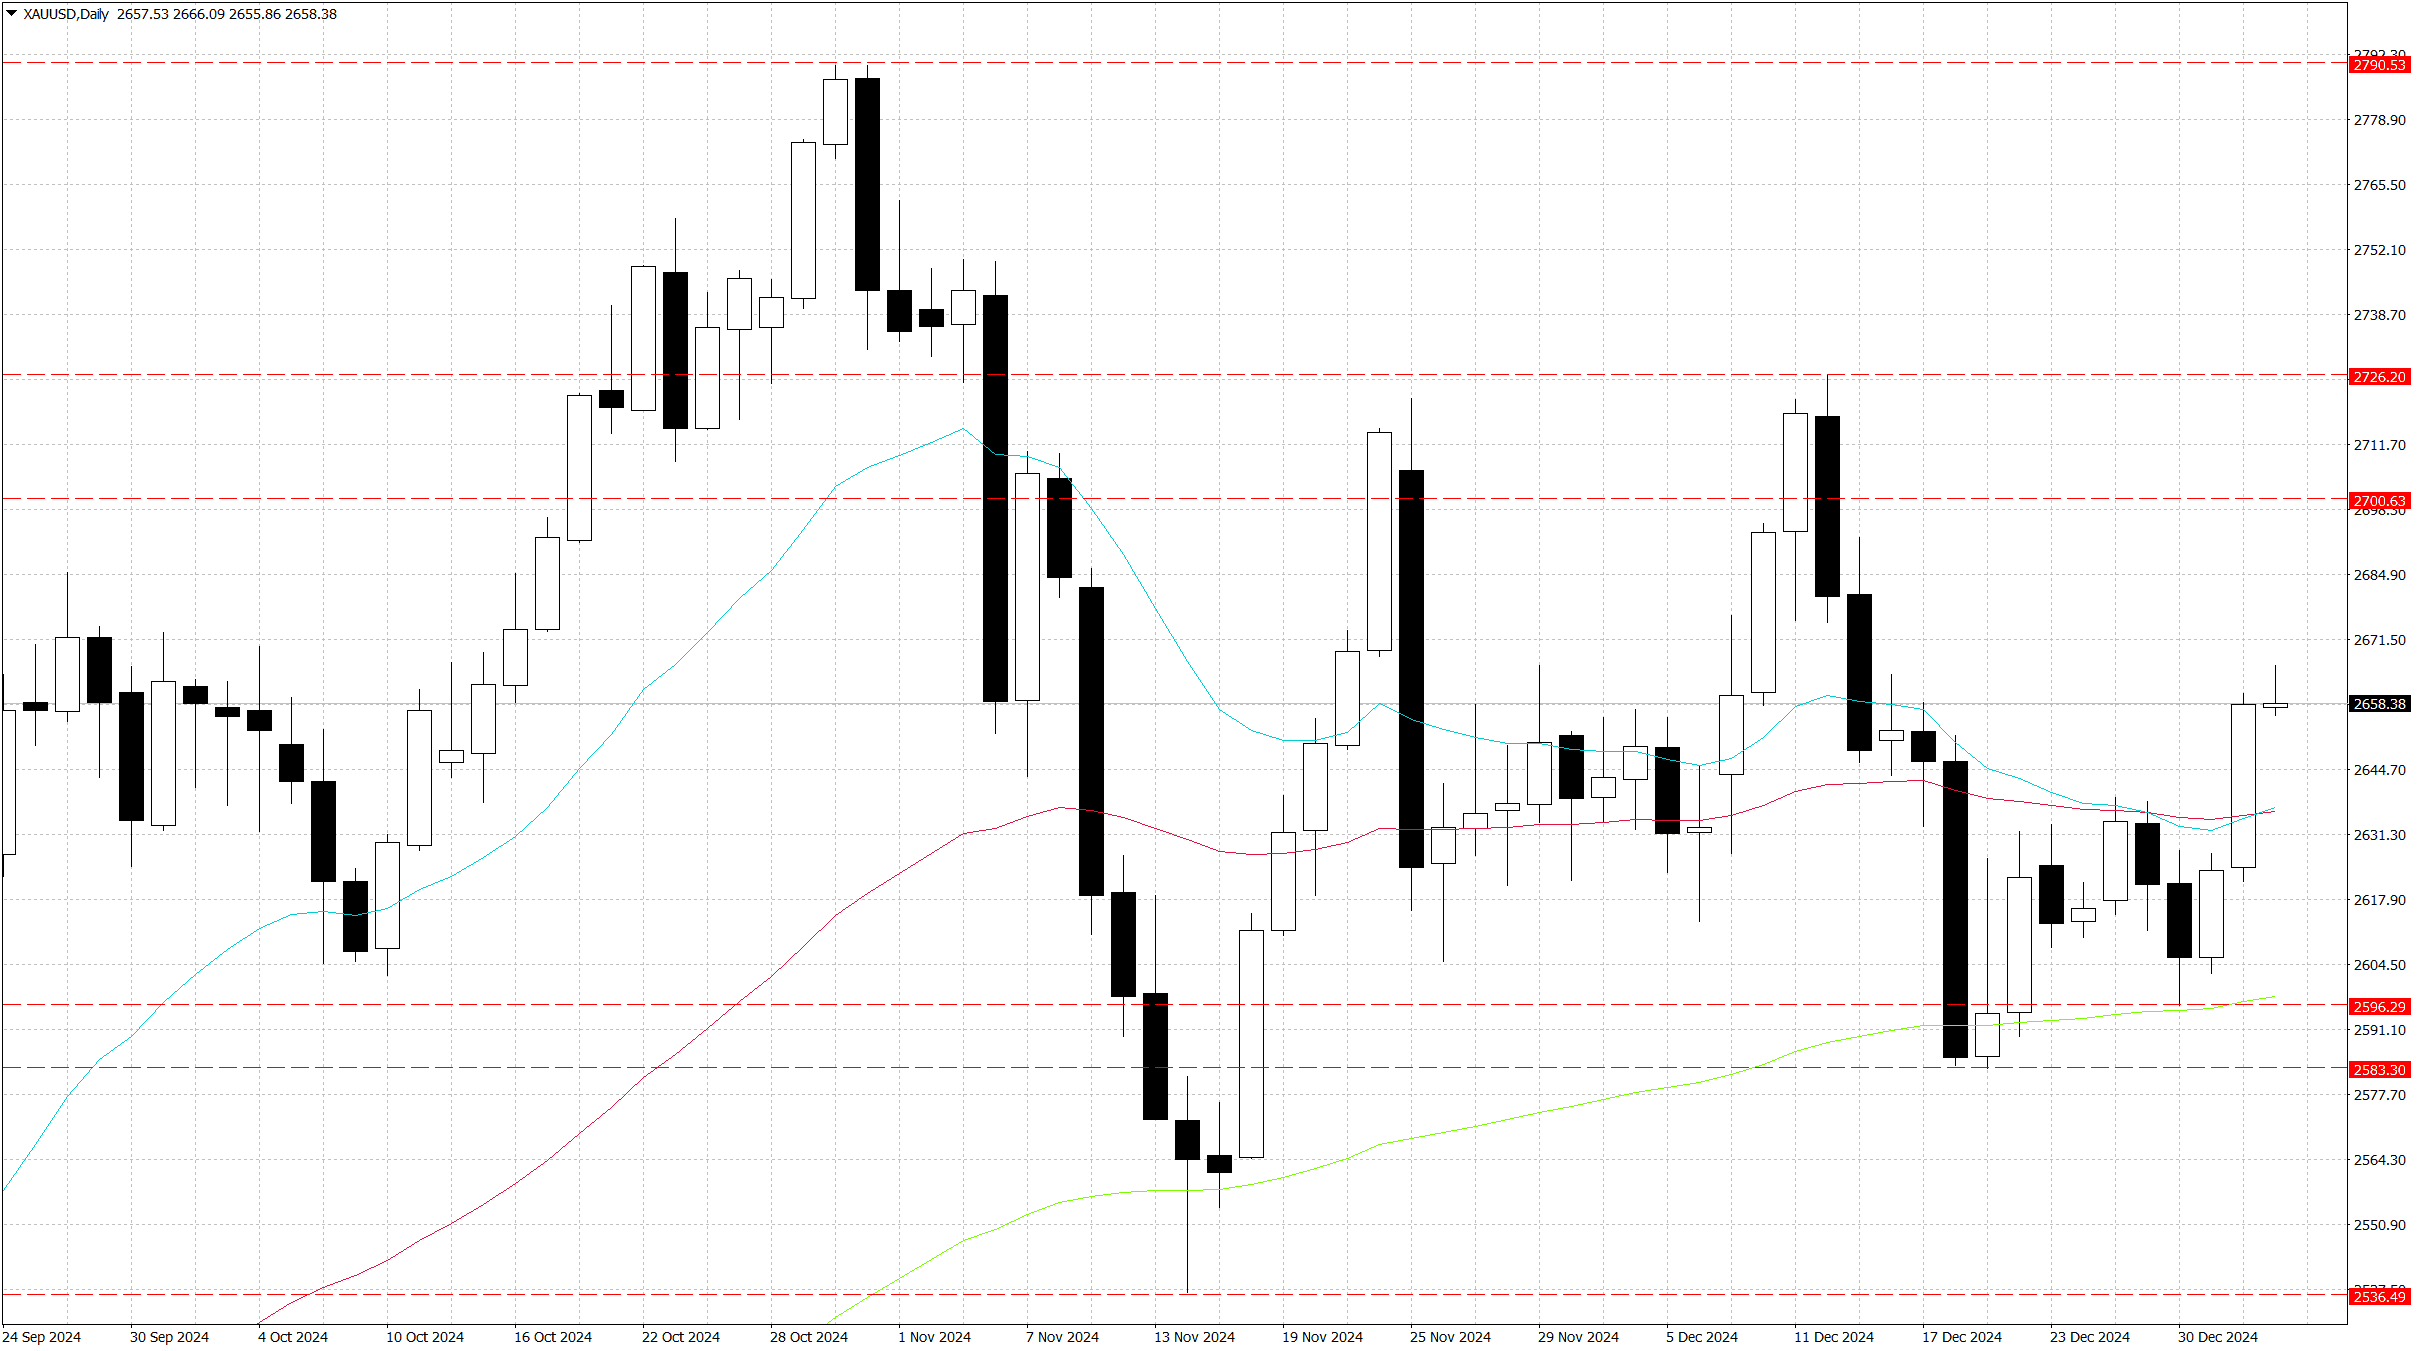
Gold market demonstrates robust fundamentals driven by central bank buying and safe-haven demand, with the metal recording its best annual performance since 2010. Technical indicators suggest continued upward momentum, though the strong US Dollar Index near 109.56 poses potential headwinds. The immediate focus remains on geopolitical developments and Federal Reserve policy signals, with institutional positioning indicating sustained bullish sentiment.
Crude oil markets show resilience amid contrasting forces of tight physical supply conditions and demand uncertainties. The combination of consistent US inventory drawdowns and potential Chinese stimulus measures provides price support, while global manufacturing weakness and trade policy concerns cap upside potential. Technical analysis reveals an improving trend structure, with prices consolidating above key moving averages and momentum indicators suggesting further upside potential.

The gold market continues to benefit from multiple supportive factors, with geopolitical tensions taking centre stage. Recent reports of US President Biden considering contingency plans for strikes on Iran's nuclear facilities have intensified safe-haven demand. The precious metal's appeal is further enhanced by expectations of monetary policy easing, with the Federal Reserve signalling a cautious approach to rate cuts in 2025. Central bank buying remains robust, with the World Gold Council indicating continued strong purchase intentions for 2025. However, the metal faces headwinds from a resilient US Dollar Index trading near multi-year highs at ... . The incoming Trump administration's policy uncertainties, particularly regarding trade and inflation, add another layer of complexity to the market outlook. Chinese economic indicators suggest mixed recovery prospects, with services and construction sectors showing improvement while manufacturing remains subdued.
The technical landscape for gold reveals a constructive setup with emerging bullish momentum. The primary resistance level sits at ... , marking the December 12 high, followed by the psychological barrier at ... , where significant selling interest has historically emerged. The immediate support structure begins at ... , aligning with the 9-day Exponential Moving Average, while secondary support rests at ... , corresponding to the December 30 weekly low and 100 day moving average. The Relative Strength Index has crossed above the ... thresholds, indicating growing bullish momentum, though the overall price action suggests cautious positioning near current levels. The break above the 50-day Simple Moving Average at ... reinforces the positive bias, with the price structure forming higher lows on the daily timeframe. The current configuration suggests a primary bullish bias, though careful attention should be paid to the reaction at the mentioned resistance levels for confirmation of continued upward momentum.


West Texas Intermediate crude oil demonstrates strengthening fundamentals supported by multiple factors affecting both supply and demand dynamics. The market has found support from six consecutive weeks of US inventory drawdowns, with the latest Energy Information Administration report showing a ... million barrel decrease in crude stocks. China's economic policy initiatives have emerged as a significant catalyst, with the National Development and Reform Commission announcing plans to increase ultra-long treasury bond funding for economic programs. This development, coupled with the People's Bank of China's anticipated interest rate cuts, suggests potential demand growth from the world's largest oil importer. However, the market faces headwinds from weak global manufacturing activity, with PMI data across Asia, Europe, and the United States indicating subdued industrial output. The incoming Trump administration's trade policies pose additional uncertainty, particularly regarding potential tariffs that could impact global trade flows and oil demand.
The technical structure for WTI crude oil presents a measured bullish bias with clear support and resistance levels defining the trading range. The immediate resistance level is established at ... , representing a significant horizontal barrier where previous rallies have faced rejection. Secondary resistance emerges at ... , a psychological level that has acted as a pivot point in recent trading sessions. On the support side, the market finds its first substantial floor at ... , coinciding with an ascending trendline that has supported price action through December. A deeper support level exists at ... , marking the three-month low and a crucial area for maintaining the current constructive bias. The Relative Strength Index reading of ... suggests strong momentum while remaining below overbought territory, providing room for potential upside continuation. The price action shows a series of higher lows, indicating persistent buying interest on dips, though the pace of advance remains measured. The 55-day Simple Moving Average at ... has transitioned from resistance to support, reinforcing the current bullish structure.


