Article by: ETO Markets
The United States released its February Durable Goods Orders data, which showed a 1.4% increase in February, better than the 1.3% predicted, and ended the previous 6.9% decline. Additionally, from a downwardly revised 104.8 in February to 104.7 in March, the Conference Board Consumer Confidence Index fell even more.
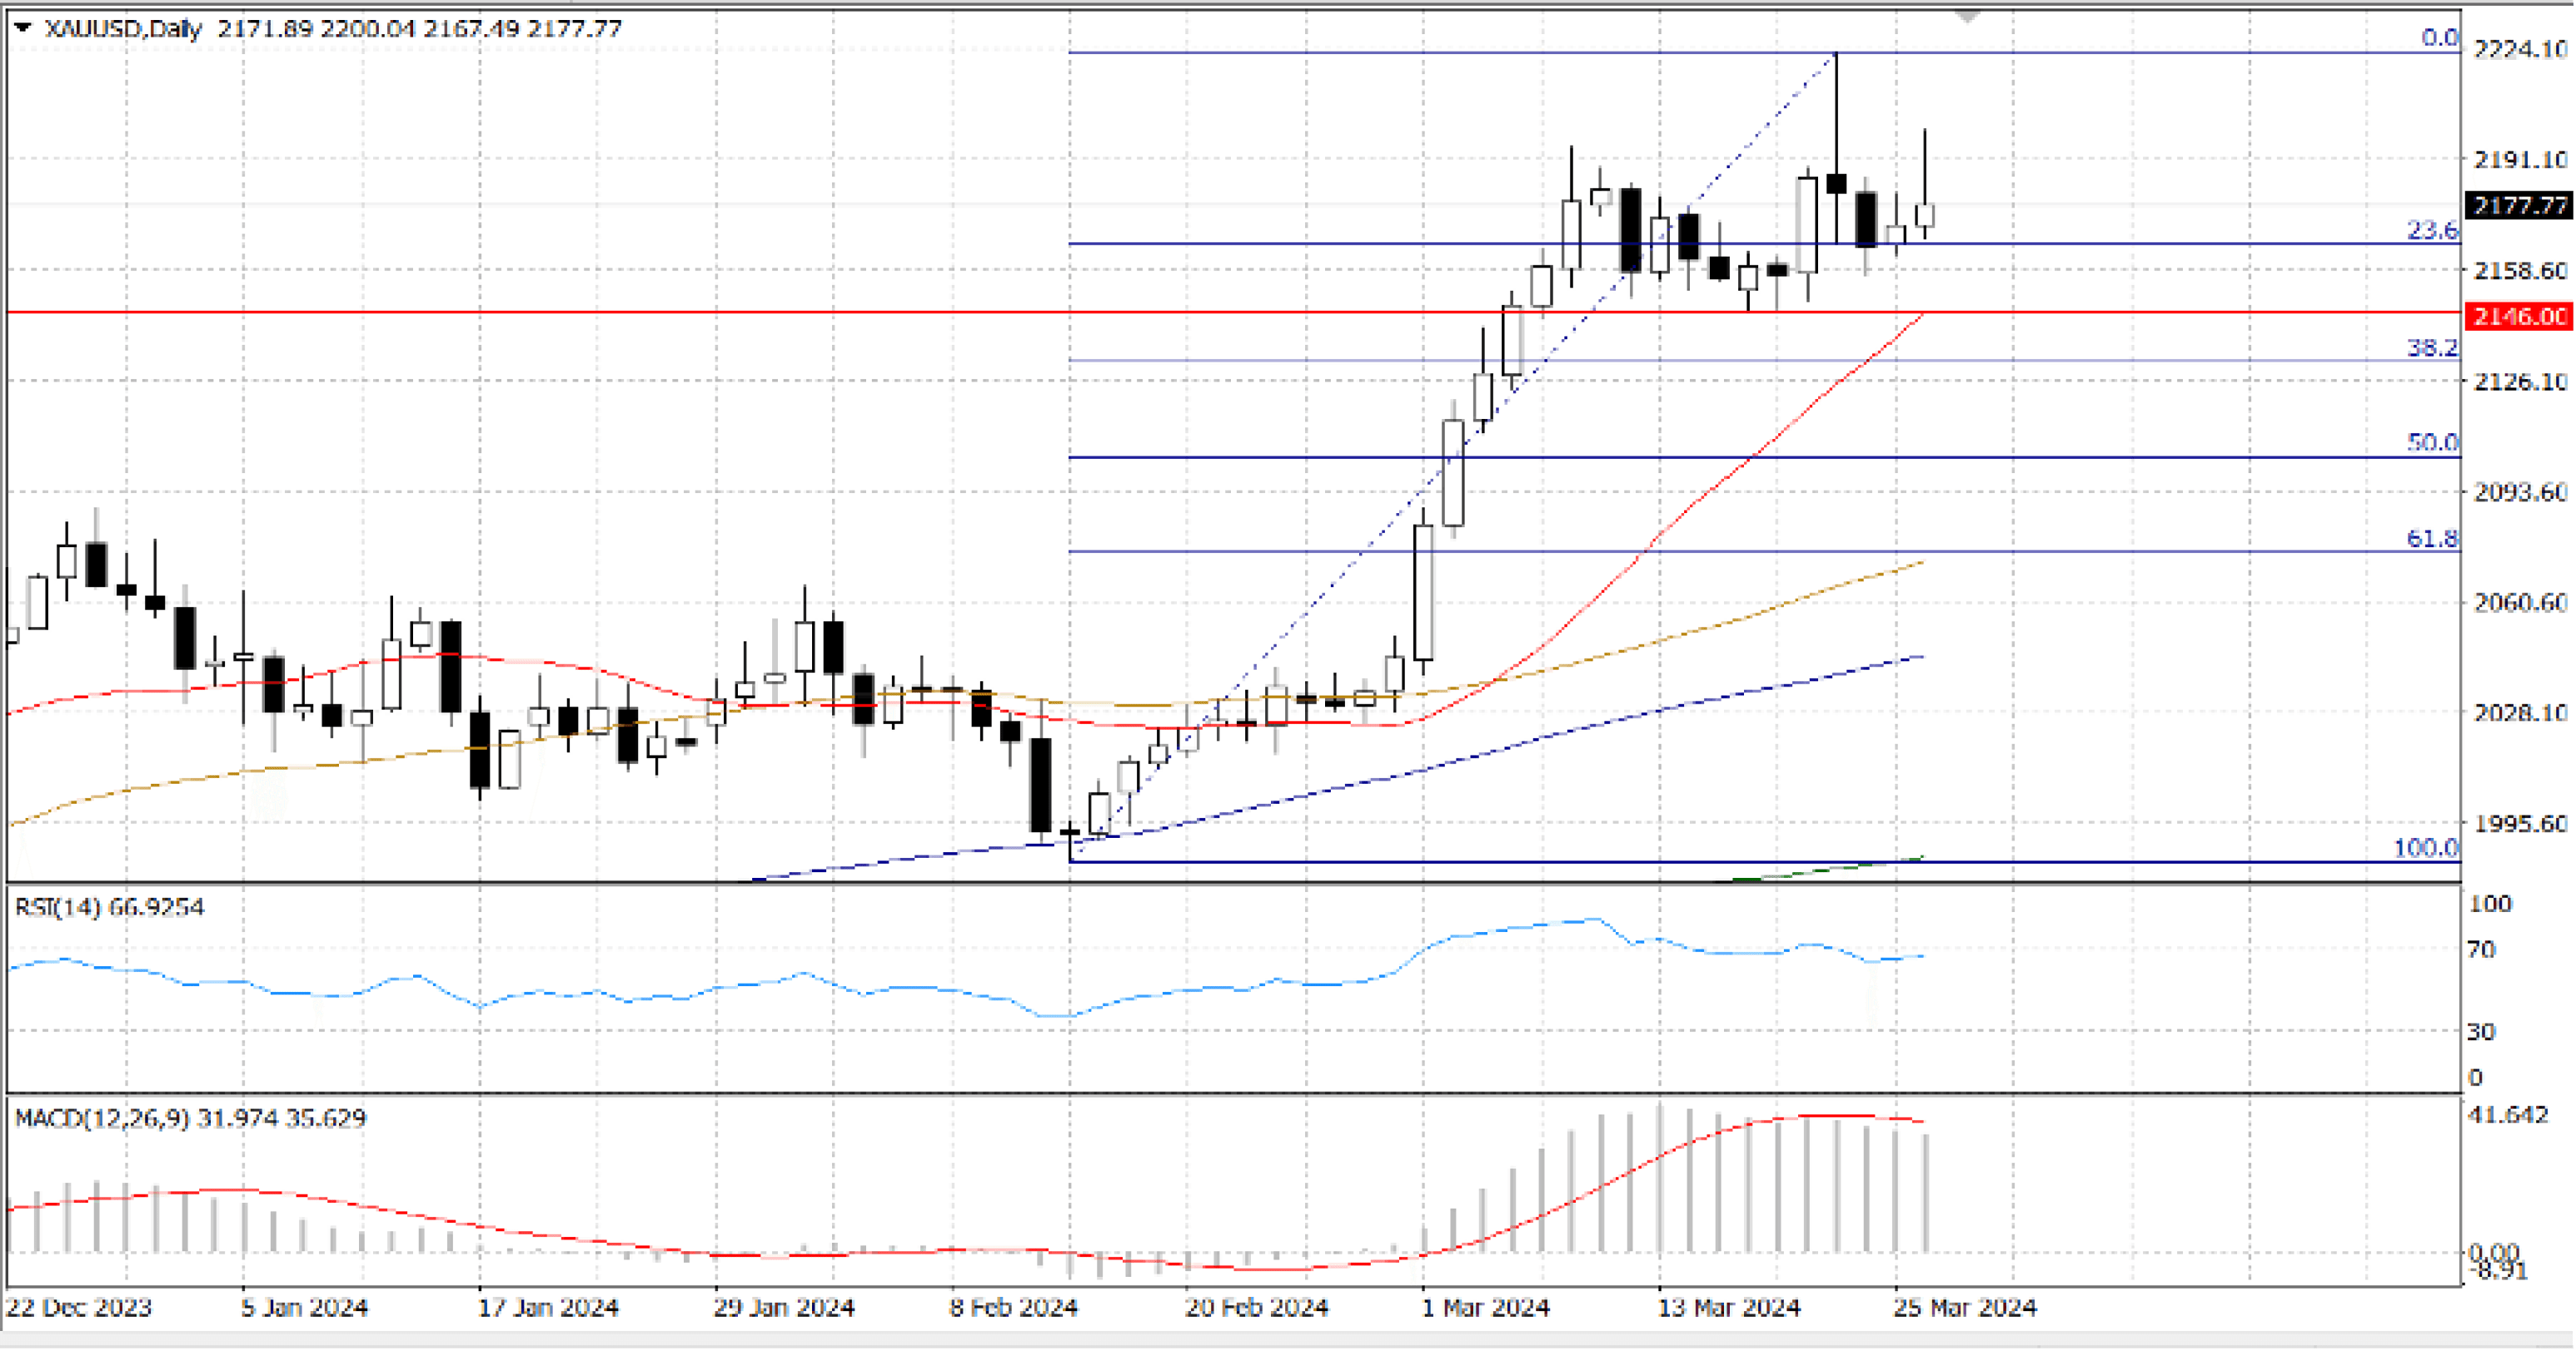
On the daily chart of XAU/USD, the Momentum indicator is deviating from the price movement. The bright metal recorded a higher high and higher low, and the indicator continued to drift within positive ranges. Conversely, the Relative Strength Index moves closer to overbought values. Ultimately, Gold price continues to rise above bullish moving averages, with dynamic support coming from the 20-SMA which is rapidly rising around $...
There are no indications of an impending decline, but the 4-hour chart indicates waning bullish pressure. Even when the 20-SMA dropped lower above bullish lengthier moving averages, XAU/USD continues to rise above all of its moving averages. In the meantime, there is little discernible directional strength in the technical indicators as they float around their midlines.


