Commodity Market Watch 04 November 2024 – 08 November 2024

Commodity Market Watch 04 November 2024 – 08 November 2024

Gold bars on a red background with a bar graph, representing the AI trading market and the commodities news.

Article by: ETO Markets

In this week, Donald Trump's re-election led to initial gold declines, as market anticipation of his inflationary policies boosted the USD, bond yields, and stocks, putting pressure on non-yielding assets like gold. However, gold rebounded as traders took profits on USD positions ahead of the Federal Reserve's rate decision. Despite this recovery, gold remains sensitive to U.S. fiscal policies and potential inflationary pressures, as Trump's stance on tariffs and spending could reignite USD strength, which would be a headwind for the non-yielding asset. 

 Crude oil prices remain in focus, with potential upside as U.S. energy policies under Trump’s administration may favor domestic production but also increase demand. The Fed’s dovish stance and rate cut could support oil by lowering the cost of capital, potentially stimulating economic activity and, in turn, energy demand. However, oil prices are likely to be influenced by global economic trends, especially as any U.S.-China trade policies could impact growth. In the near term, oil prices may see volatility as traders assess U.S. fiscal policies' potential to stoke inflation, which may lead to a pause in Fed rate cuts and influence energy markets. 

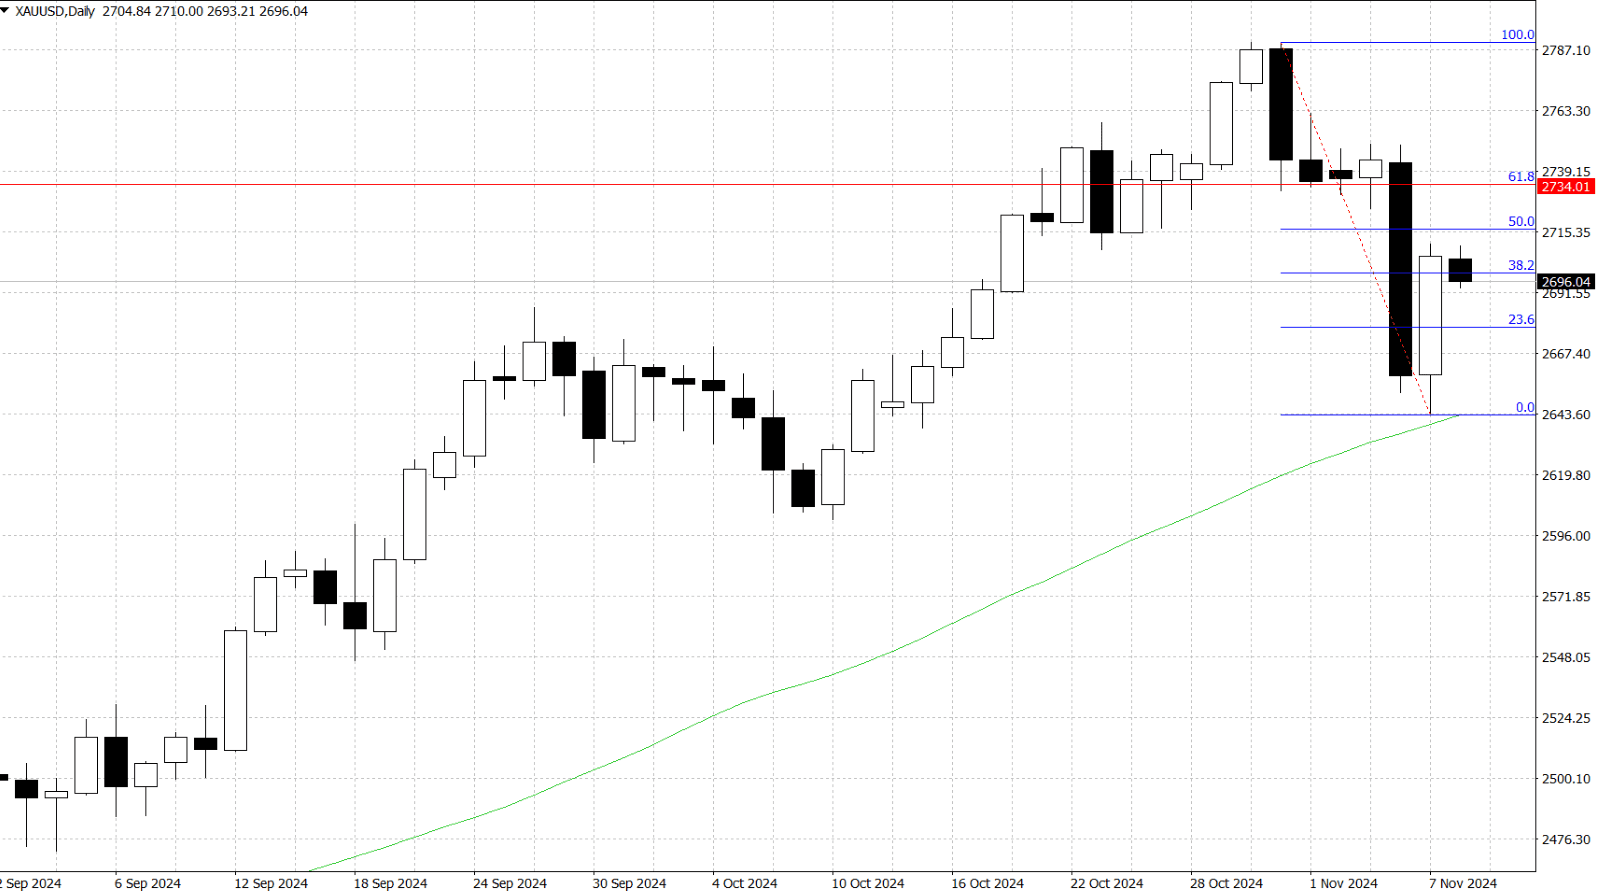
Gold prices hover around $… in Friday's Asian trading session, consolidating after two volatile days influenced by Donald Trump's re-election and the Federal Reserve's monetary policy announcements. Trump's victory initially weighed on gold as his inflation-boosting policies strengthened the US Dollar (USD) and Treasury yields, which pressured the non-yielding metal. However, gold rebounded after the Fed’s rate cut by 25 basis points to a range of 4.50%-4.75% and Fed Chair Jerome Powell’s commitment to a gradual easing cycle, which triggered USD selling. Despite the recovery, the market's renewed optimism about Trump’s policies supports the USD, posing a headwind for gold. Investors now look to US consumer sentiment, inflation expectations, and upcoming CPI data for further direction. 

From a technical perspective, gold’s recovery faces resistance near the $… level, the 50% Fibonacci retracement of its recent decline from an all-time high. A break above this point could lead to further gains toward $… (61.8% Fibo level) and possibly beyond $… , targeting the $… -… zone, which includes the record high from October 31. On the downside, immediate support is at $… , with further support at $… and the 50-day SMA around $… . A break below this SMA could intensify bearish momentum, potentially driving gold towards the October swing low near $… -… , as daily chart oscillators show weakening bullish traction. 


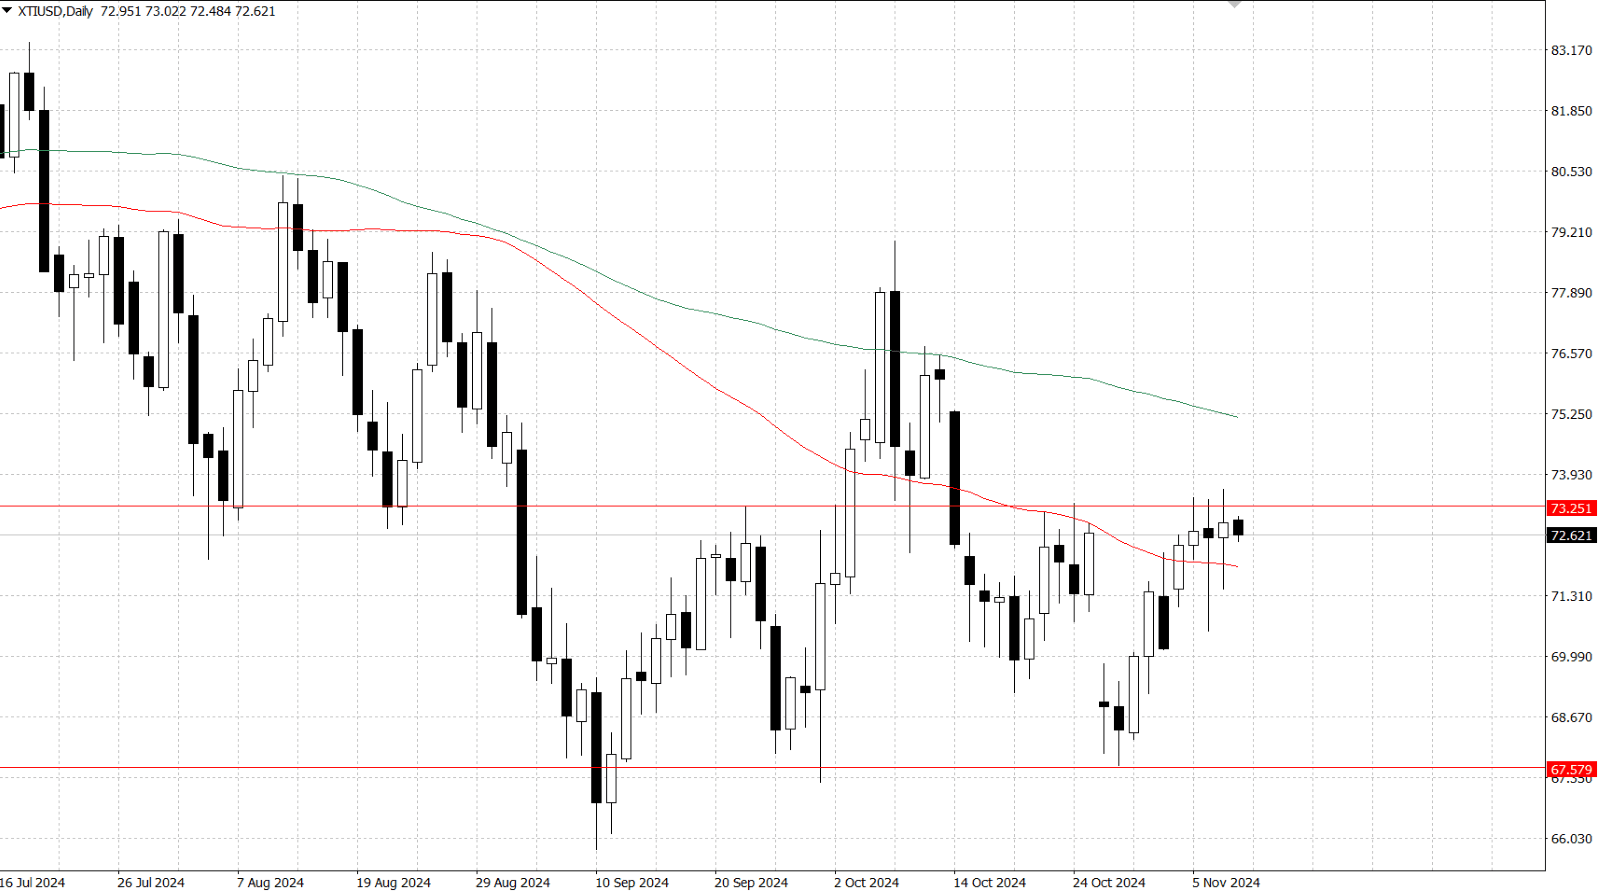
WTI crude oil prices stabilize around $… per barrel during Friday's Asian session, aiming for a weekly gain of over 3% as investors weigh factors influencing supply and demand. The Federal Reserve’s recent 25 bps rate cut to a range of 4.50%-4.75% may support U.S. economic activity and boost oil demand, with Chair Jerome Powell signaling continued rate assessments as inflation slows toward the Fed’s 2% target. Additionally, potential sanctions from the Trump administration on Iran and Venezuela, as well as Hurricane Rafael-induced supply disruptions in the Gulf of Mexico, could limit oil supply. However, a 9% drop in China’s crude oil imports and six consecutive months of year-on-year declines present downside risks, though investors remain hopeful for stimulus measures from China to support demand. 

In the point of technical view, WTI crude oil (XTI/USD) shows the price just breaks the 55-day Simple Moving Average (SMA), which currently acts as immediate support level near $…. A further support level, $…, indicated by the overall fluctuating trend. On the flip side, $… could be a resistance level supported by the overall trend channel. If it breaks the level, $… should be considered as a next resistance level indicated by the 100-day SMA.  


Want completely chart technical analysis
and trade recommendations on?

Want completely chart technical analysis
and trade recommendations on?

Want completely chart technical analysis
and trade recommendations on?

  • Forex

    Precious Metals

    Energies

    Indices

    Crypto CFDs

  • Forex

    Precious Metals

    Energies

    Indices

    Crypto CFDs

Disclaimer

ETO Markets Limited is registered in Seychelles with Company Number 850672-1 and authorised by the Financial Services Authority (FSA), Licence Number SD062; ETO Markets LLC is registered in Saint Vincent and the Grenadines with Company Number 3286LLC2023.


The information provided on this website is general in nature only and does not constitute personal financial advice. Please note that investing in CFDs and Margin FX Contracts carries significant risks and is not suitable for all investors. You don’t own, or have, any interest in the underlying assets. Any information or general financial product advice given is generic in nature and does not take into account your financial situation, needs or personal objectives. Past performance is not a reliable indicator of future performance. Investing in leveraged products carries significant risks. We recommend that you seek independent advice and ensure that you fully understand the risks involved before trading. It is important that you read and consider our disclosure documents
(Privacy Policy & Risk Disclosure) before you acquire any product.

2024 ETO Markets | All rights reserved

c