Article by: ETO Markets
In this week's energy market, North Sea oil loadings for January are scheduled at approximately 587,000 barrels per day, the lowest since October, as geopolitical and market developments continue to shape the energy landscape. Despite a ceasefire between Israel and Hezbollah taking effect on Wednesday, Israel conducted tactical operations in Gaza and Lebanon, citing targeted actions outside the ceasefire terms, further raising tensions in the region. Additionally, Israel has warned displaced residents in southern Lebanon not to return home, complicating the regional outlook. Meanwhile, OPEC+ has postponed its Sunday output policy meeting to December 5 due to key ministers attending the Gulf Cooperation Council meeting in Kuwait. Furthermore, China’s independent refiners are purchasing barrels from the Middle East and Africa, as Iranian oil becomes less accessible and more expensive due to expanding U.S. sanctions.
In the precious metals market, the U.S. Dollar continues its subdued performance against major currencies despite President-elect Donald Trump's tariff announcements, as markets focus on the increasing likelihood of a 25-basis-point Federal Reserve rate cut in December, now priced at a 63% probability. The Fed’s dovish stance and geopolitical tensions between Russia and Ukraine are supporting gold prices, which are also bolstered by safe-haven demand. Reports of Russian President Vladimir Putin threatening Kyiv with ballistic missiles and retaliatory strikes on Ukraine's energy grid have heightened market caution. With U.S. traders largely inactive due to the Thanksgiving holiday, gold price movement could depend on Eurozone inflation data and end-of-week flows, especially if the U.S. Dollar weakens further.

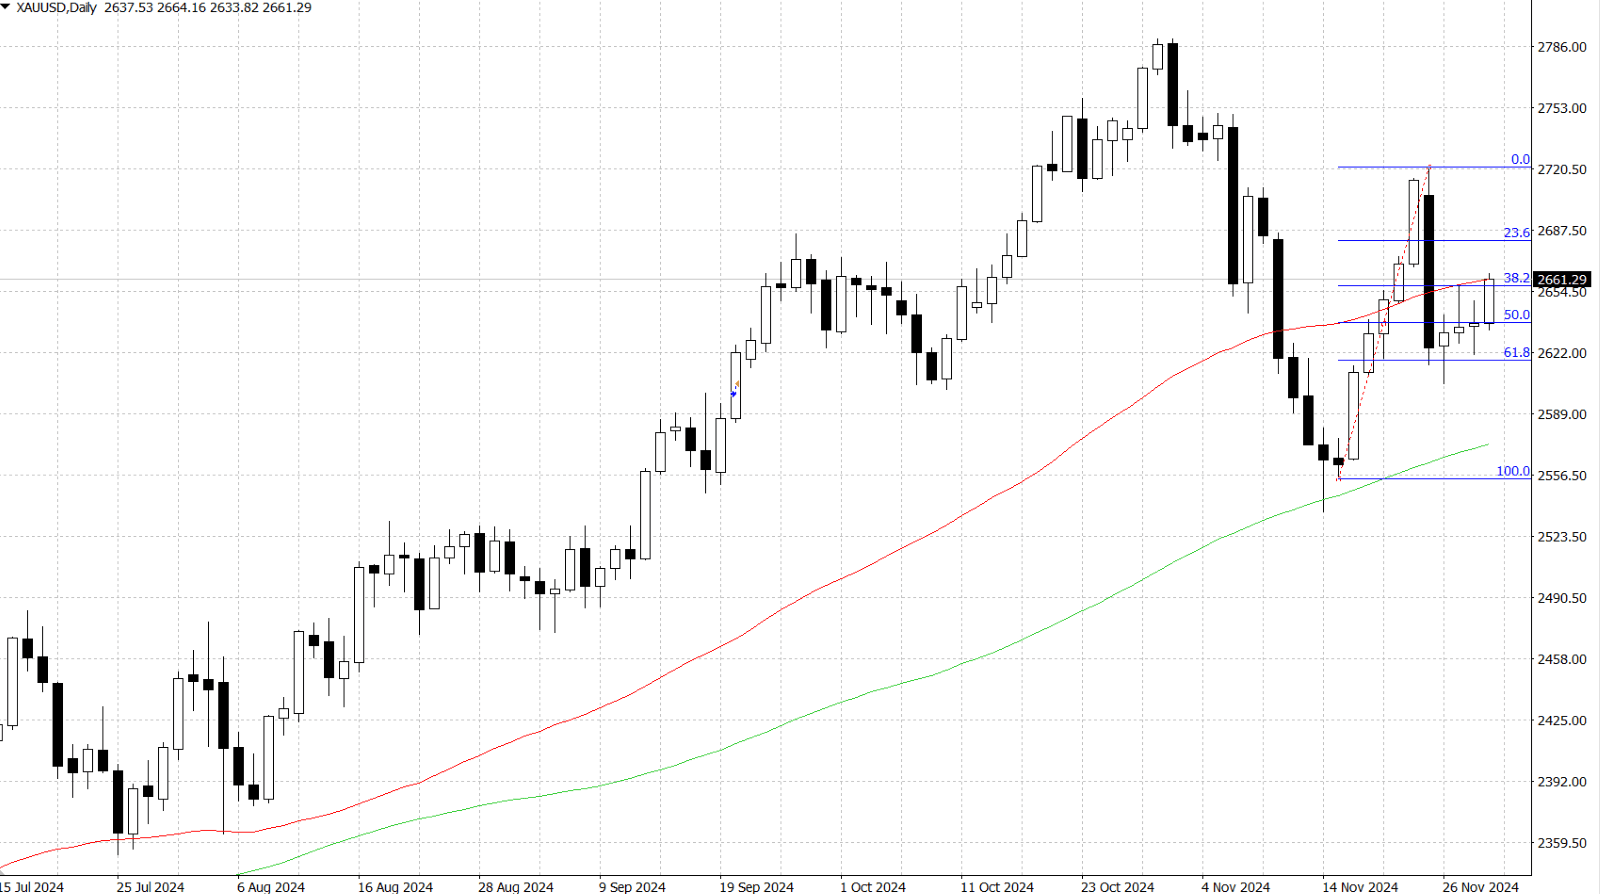
Gold (XAU/USD) spikes to a four-day high around $…-… as geopolitical tensions, trade war fears, and expectations of Federal Reserve rate cuts boost demand for safe-haven assets. The US Dollar struggles near a two-week low due to these factors, although the US PCE data shows stalled inflation, suggesting the Fed may slow its rate cuts, which could support the USD and cap gold's gains. Meanwhile, Russian President Putin threatens to use hypersonic missiles against Ukraine, and US President-elect Trump’s tariff plans on Canada, Mexico, and China raise concerns of trade wars. The Fed is divided on further rate cuts, and the 10-year US Treasury yield hits a two-week low amid hopes of controlling US deficits. With no major economic data expected on Friday and early closures for the Thanksgiving holiday, market uncertainty persists.
From a technical perspective, an intraday breakout above the $…-… zone, which combines the 55-day Simple Moving Average (SMA) and the 38.2% Fibonacci retracement, acted as a key bullish trigger. However, the price stalls near the $…-… region, where the 50% Fibonacci level serves as a pivotal point. If buying momentum continues, gold could rise to the $… area (61.8% Fibonacci level) and approach the $… mark. On the downside, the $… resistance now acts as key support. A drop below this level could bring gold back to the $… area (23.6% Fibonacci level) and further to the $… region. Additional selling below $… could lead to deeper losses towards the 100-day SMA around $…, possibly reaching the monthly low near $…-….


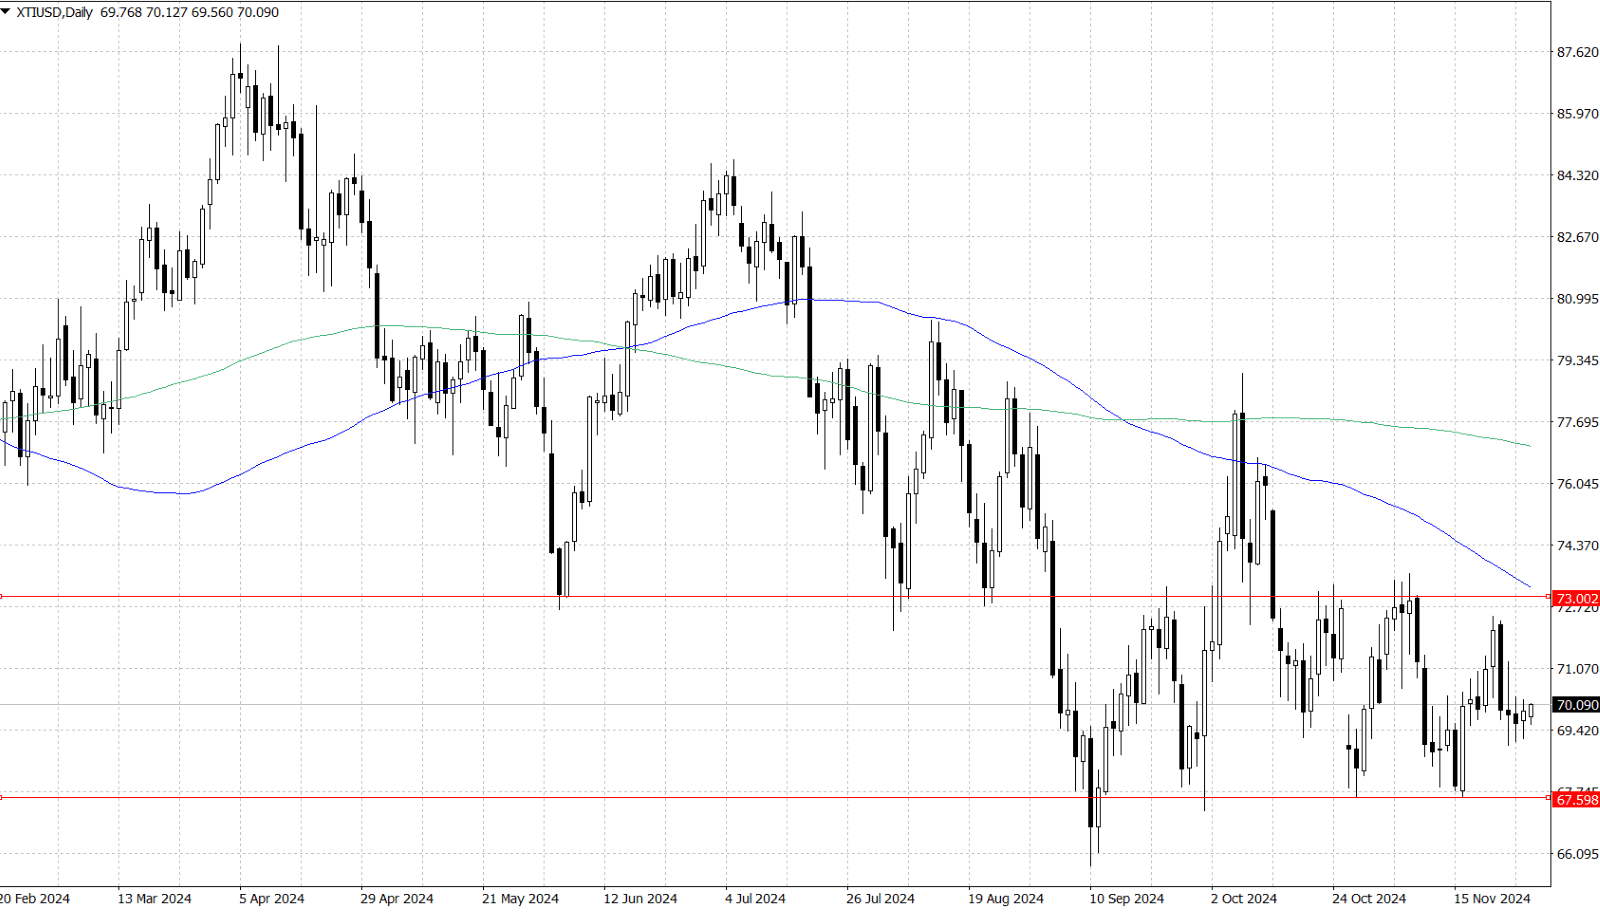
West Texas Intermediate (WTI) crude oil steadied around $… area on Friday as escalating tensions in the Russia-Ukraine conflict offset reduced expectations of aggressive Federal Reserve rate cuts. Concerns over energy supplies, particularly winter gas flows to Europe, have grown after Russian President Vladimir Putin warned of severe consequences if Ukraine acquires nuclear weapons. Meanwhile, slower-than-expected rate reductions by the Fed could keep borrowing costs high, potentially dampening economic activity and oil demand. OPEC+ postponed its December meeting to December 5, fueling speculation about delaying planned output increases for January and extending existing production cuts amid uncertain demand, which has already been factored into oil prices.
From a technical perspective, the key resistance levels for the price are at $… supported by the November 8 high and the following 100-day Simple Moving Average. If the price continues to rise, the 200-day SMA at $… could be tested as a potential hurdle. On the downside, the first support is at $… as the previous two months low, followed by around $… area (2024 year-to-date low) if the price breaks lower.


