Article by: ETO Markets
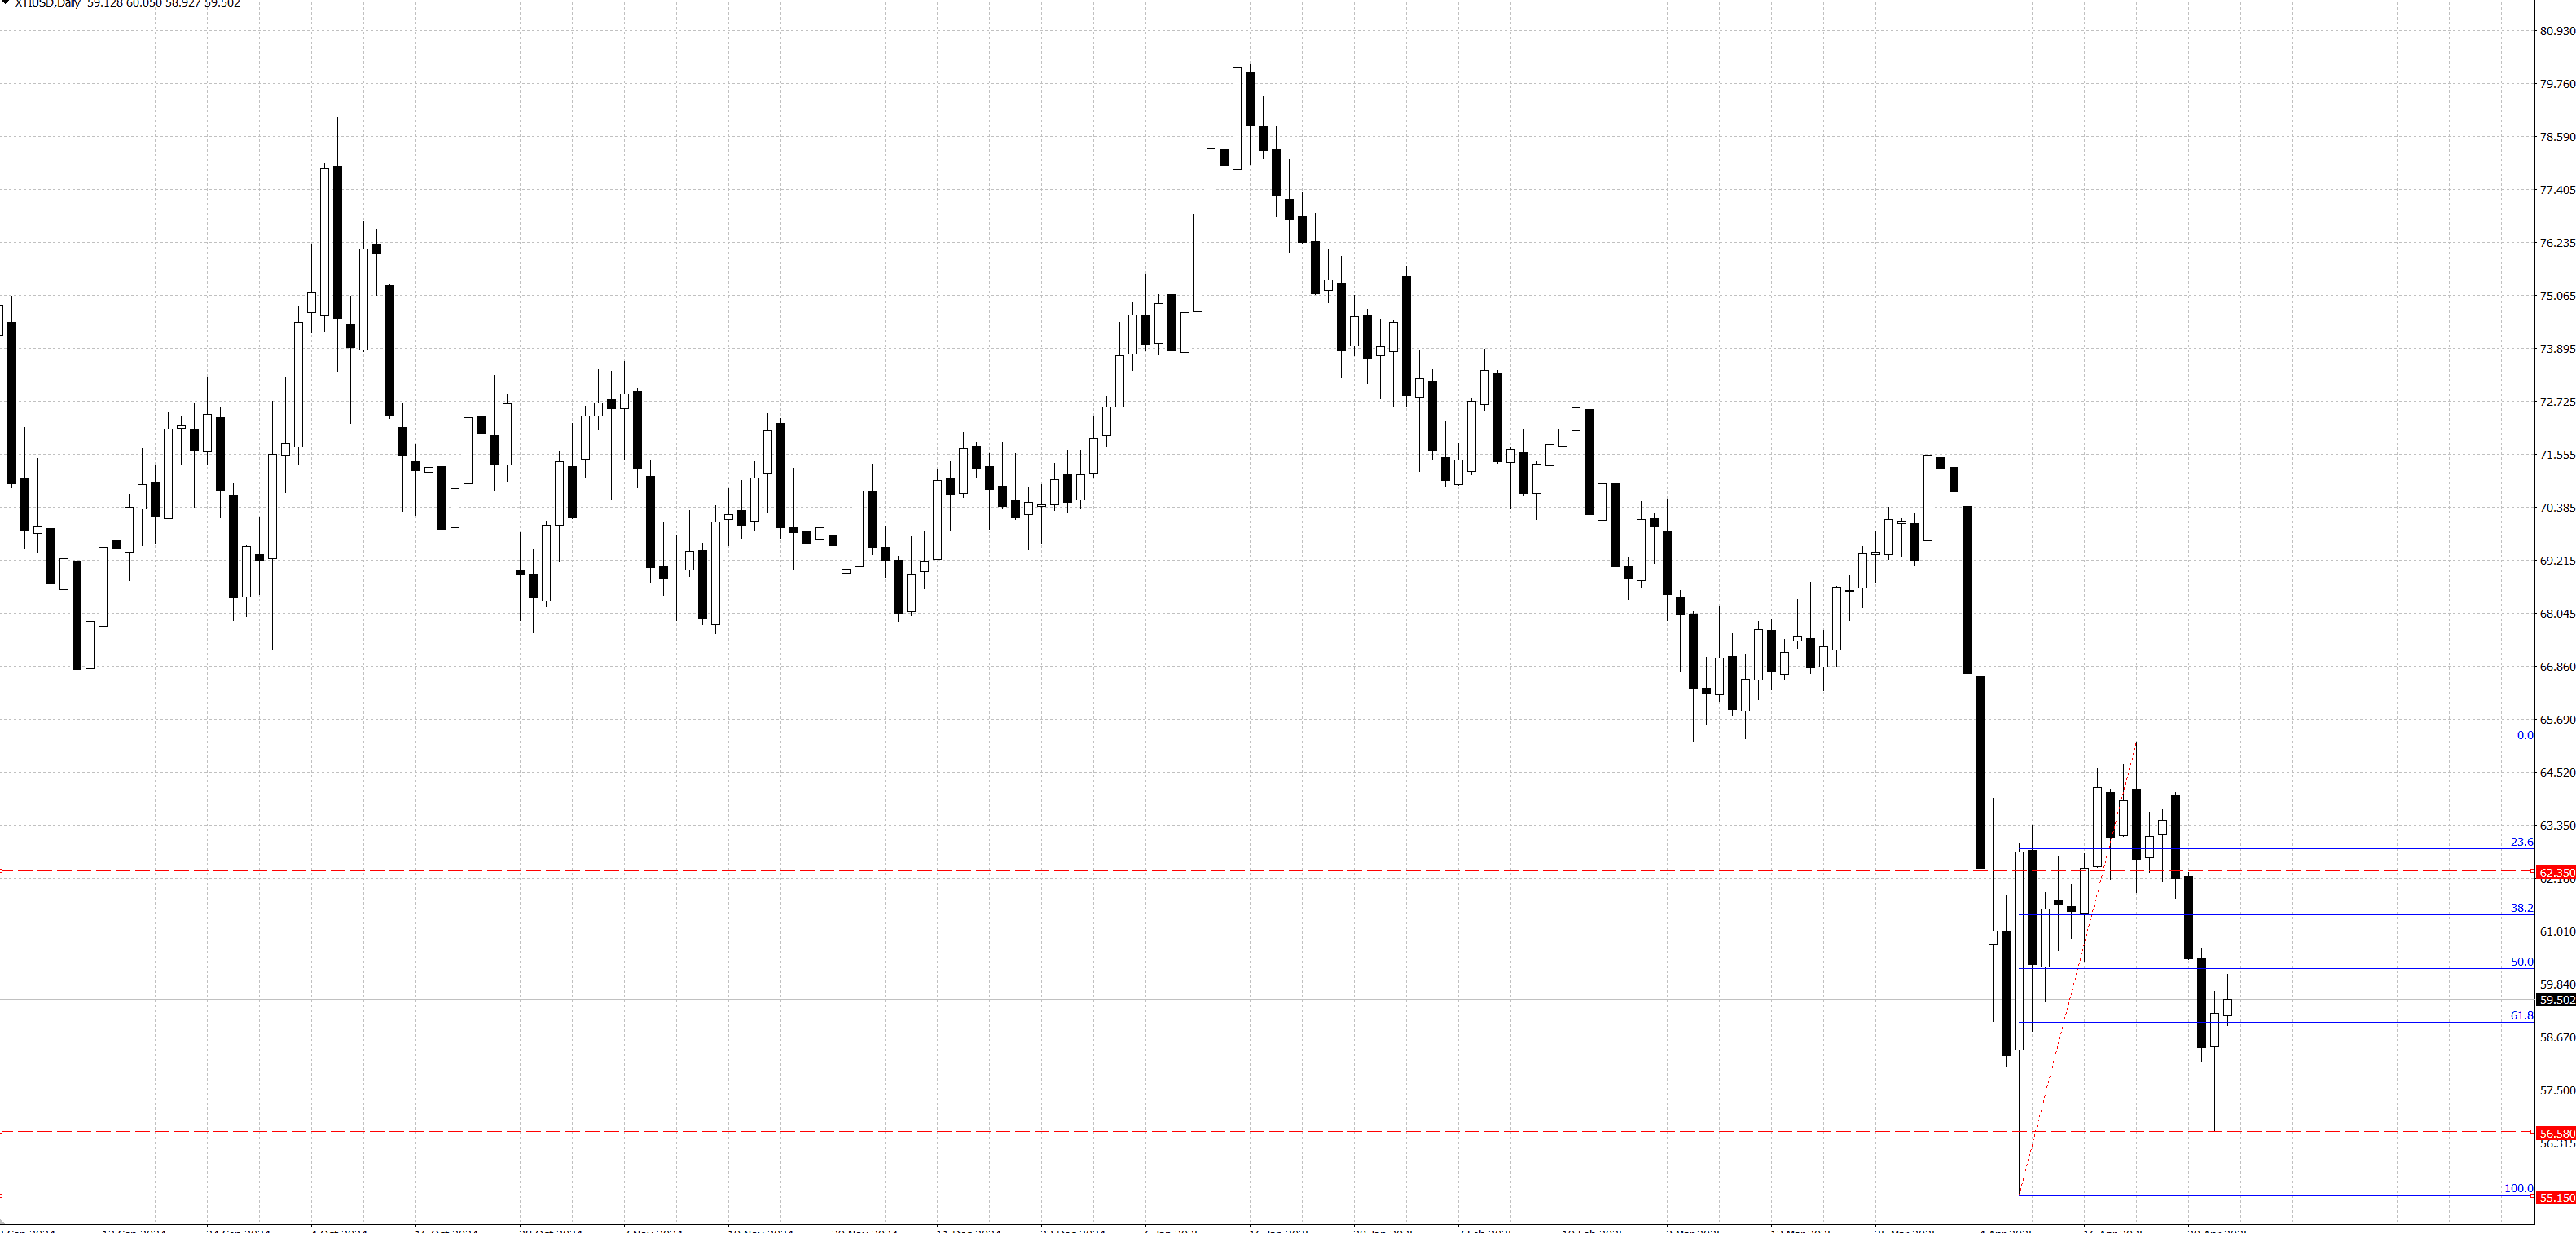
Oil prices took a sharp dive, with WTI plunging over 4% to below $58, capping what could be the worst April performance since 2021 and potentially the ugliest on record. The immediate trigger was Saudi Arabia’s strategic shift: abandoning its long-standing defense of price floors in favor of reclaiming market share, even at the expense of lower prices. After years of OPEC+ output cuts and growing frustration with quota violations from members like Iraq and Kazakhstan, Riyadh has signaled it’s done playing the enforcer, instead kickstarting output with a surprise 411,000 bpd bump for May. This pivot leaves the oil market vulnerable, especially as major producers including the U.S., Canada, and Guyana continue to ramp production, threatening a significant supply glut. Meanwhile, demand signals remain bleak—U.S. GDP unexpectedly contracted in Q1, China’s factory activity slipped into contraction, and global freight indicators have long been pricing in economic slowdown. With Saudi needing $90 oil to balance its budget and Russia under similar fiscal pressure, the abandonment of price defense suggests a deeper, longer slump may be underway. Until tangible signs of demand revival emerge—such as a trade breakthrough or fiscal stimulus—investors should brace for a drawn-out period of oversupply and falling prices, with capex cuts and rig declines likely to be early indicators of stabilization ahead.

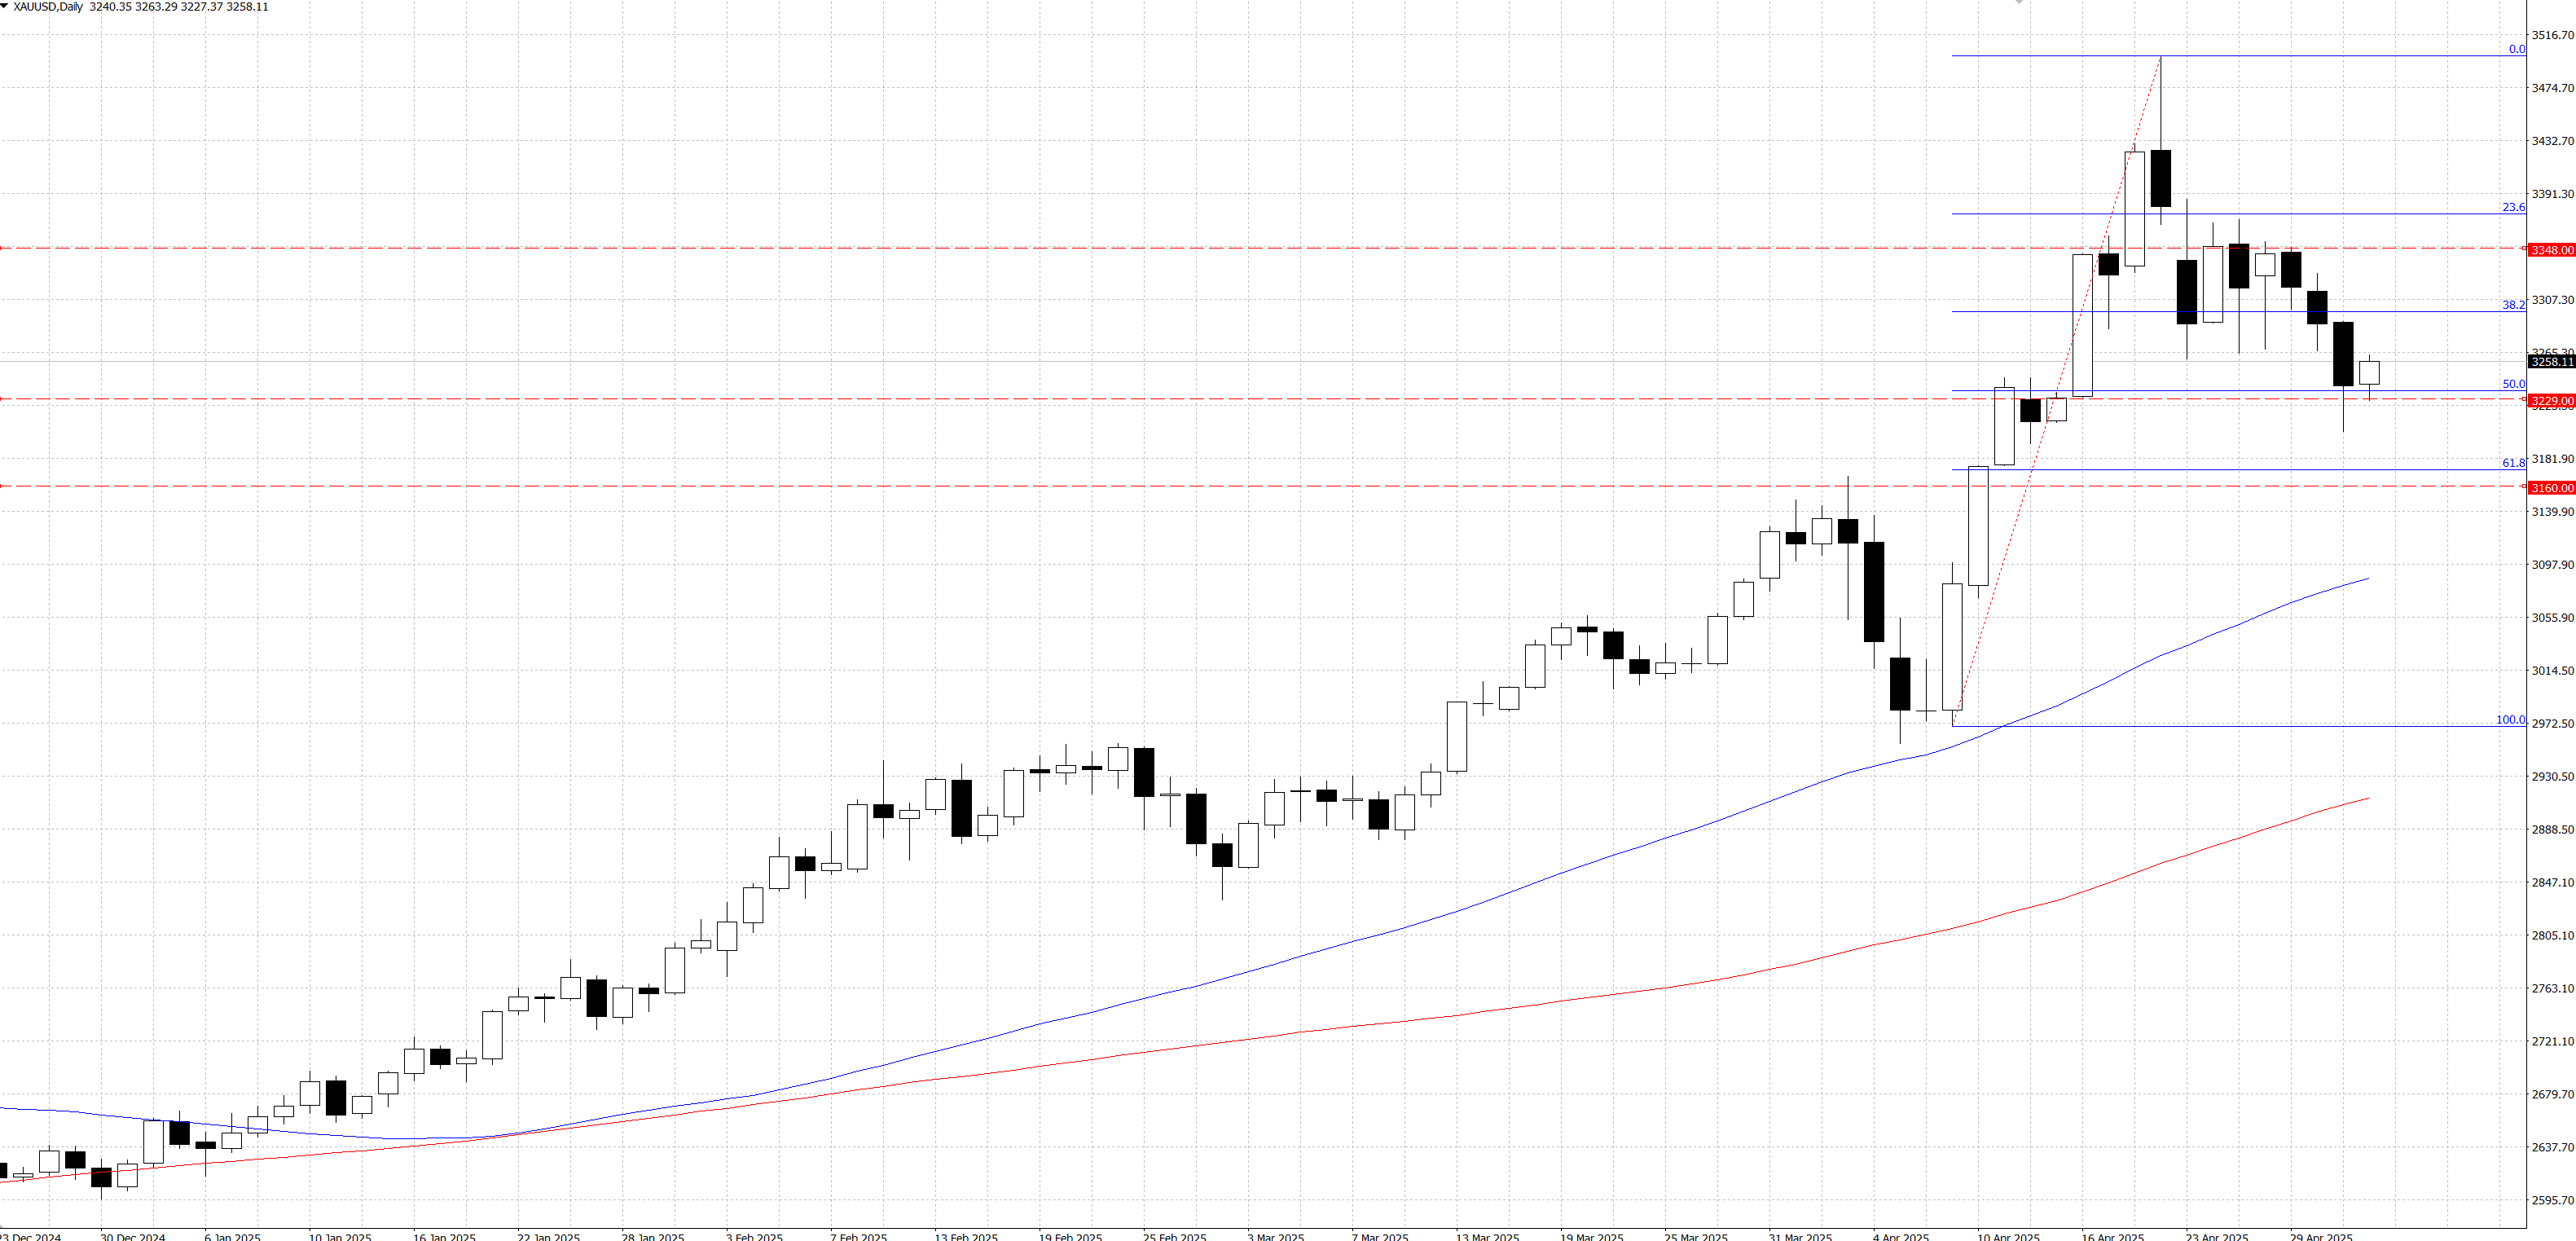
Gold has edged slightly higher in early European trade but remains capped below the former $3,260–3,265 support zone—now acting as resistance—reflecting a lack of bullish conviction even as the dollar, having paused a three-day rally at a three-week peak, offers support to the non-yielding metal. Optimism over a potential de-escalation in US–China trade tensions—underscored by Beijing’s confirmation of fresh US overtures to negotiate tariffs—has buoyed risk sentiment and lent strength to the greenback, while traders brace for this Friday’s US Nonfarm Payrolls report for further Fed policy clues. Recent US data have fueled dovish Fed expectations: first-quarter GDP unexpectedly contracted for the first time since 2022, the PCE Price Index showed easing inflation, the ADP survey signaled a cooling labor market, initial jobless claims rose to 241,000 (their highest since February), and the ISM Manufacturing PMI held in contraction at 48.7 in April. Against this backdrop, markets price in four quarter-point rate cuts by year-end and anticipate April’s payrolls to rise by 130,000 (down from 228,000 in March), with the unemployment rate steady at 4.2% and average hourly earnings up 0.3%.
From a technical perspective, yesterday’s failure to hold the $…–… zone—and the 50% retracement of the rally from the mid-$…—provided fresh impetus for bears, yet daily oscillators, while rolling over, have not fully turned negative, prompting short-covering and propping up prices. In the near term, the former support at $…–… now acts as resistance and must be reclaimed before any real upside can materialize; a clear break there would initially target $…, a pivotal level whose breach could open the door to the $…–… supply zone. Further follow-through buying above that area would indicate that the corrective pullback from the all-time high has likely run its course and could drive gold toward $…–… to test $…. Conversely, on the downside, the 50% retracement around $…–… offers initial support ahead of yesterday’s low near $…–…; a decisive break below that swing bottom would reinforce bearish momentum and expose gold to a drop toward the $… round figure and potentially down to the 61.8% retracement near $…

WTI crude extended its rally for a second day on Friday, trading near $59.40 per barrel in early Asian hours, as hopes of renewed trade diplomacy between the U.S. and its biggest oil customers bolstered sentiment. President Trump’s overtures toward trade deals with India, Japan, and South Korea—and China’s reported willingness to pick up talks so long as core tariff grievances are addressed—eased growth concerns just enough to lift oil after recent weakness. At the same time, Trump’s threat of secondary sanctions on any country still buying Iranian crude underscored Washington’s hard line on Tehran, even as nuclear negotiations slated for Rome were postponed. Despite this two-day rebound, WTI is set for roughly a 5 percent weekly loss amid lingering U.S.–China trade jitters, an unexpected Q1 GDP contraction, and China’s worst factory slowdown in over two years. Adding pressure, Saudi Arabia has signaled that it will refrain from further output cuts—and may even agree to production increases at OPEC+’s May 5 meeting—suggesting the market must fend for itself amid a looming supply glut.
From a technical perspective, a daily close below the newly signaled level would cement a fresh bearish bias for WTI, targeting the $… mark—a key psychological level and the 50 percent retracement of the recent corrective move. A firm break below $… would confirm that the corrective phase has ended and shift the near-term outlook decisively negative. Conversely, if prices fail to breach the $… pivot, immediate downside pressure would ease, preserving the potential for a healthier upside correction—though such a rally would need to clear and close above the resistance at $… to be deemed valid. Conversely, the immediate support level would be at $… as the start point of corrective phase. If the price breaks the level, the price should be targeted to the $…. Technical studies are mixed: the indicator lines remain in bearish alignment, yet momentum readings are strengthening, and the stochastic oscillator hovers at the edge of oversold territory.